
Driving Change in Sustainability Software
Company: IBM
Timeline: 6 weeks
Date: August - September, 2023
Industry: Supply Chain, Sustainability
Background
IBM was launching a new sustainability product by integrating a legacy supply chain tool with Envizi, its newly acquired reporting platform, to help enterprises measure Scope 3 emissions from purchased goods and services.
A unified design research strategy was critical to define MVP use cases, personas, and needs, while also validating future scenarios to shape long-term prioritisation. Under high pressure and shifting stakeholder demands, design research provided the clarity and alignment needed to guide strategy and position the product for market success.
Project Overview
I designed and led the cross-product research strategy, aligning two software teams around shared strategic insights. I facilitated leadership conversations, resolved conflicts, and used evidence-based findings gathered by my UX Research team to prioritise features and concepts.
Acting as a “beacon in the dark,” I ensured research insights influenced both near-term MVP delivery and the product-led growth (PLG) strategy, which resulted in the solution's first large enterprise client within the first month of launch and 6 multi-national customer success stories within its first year
Research Objectives
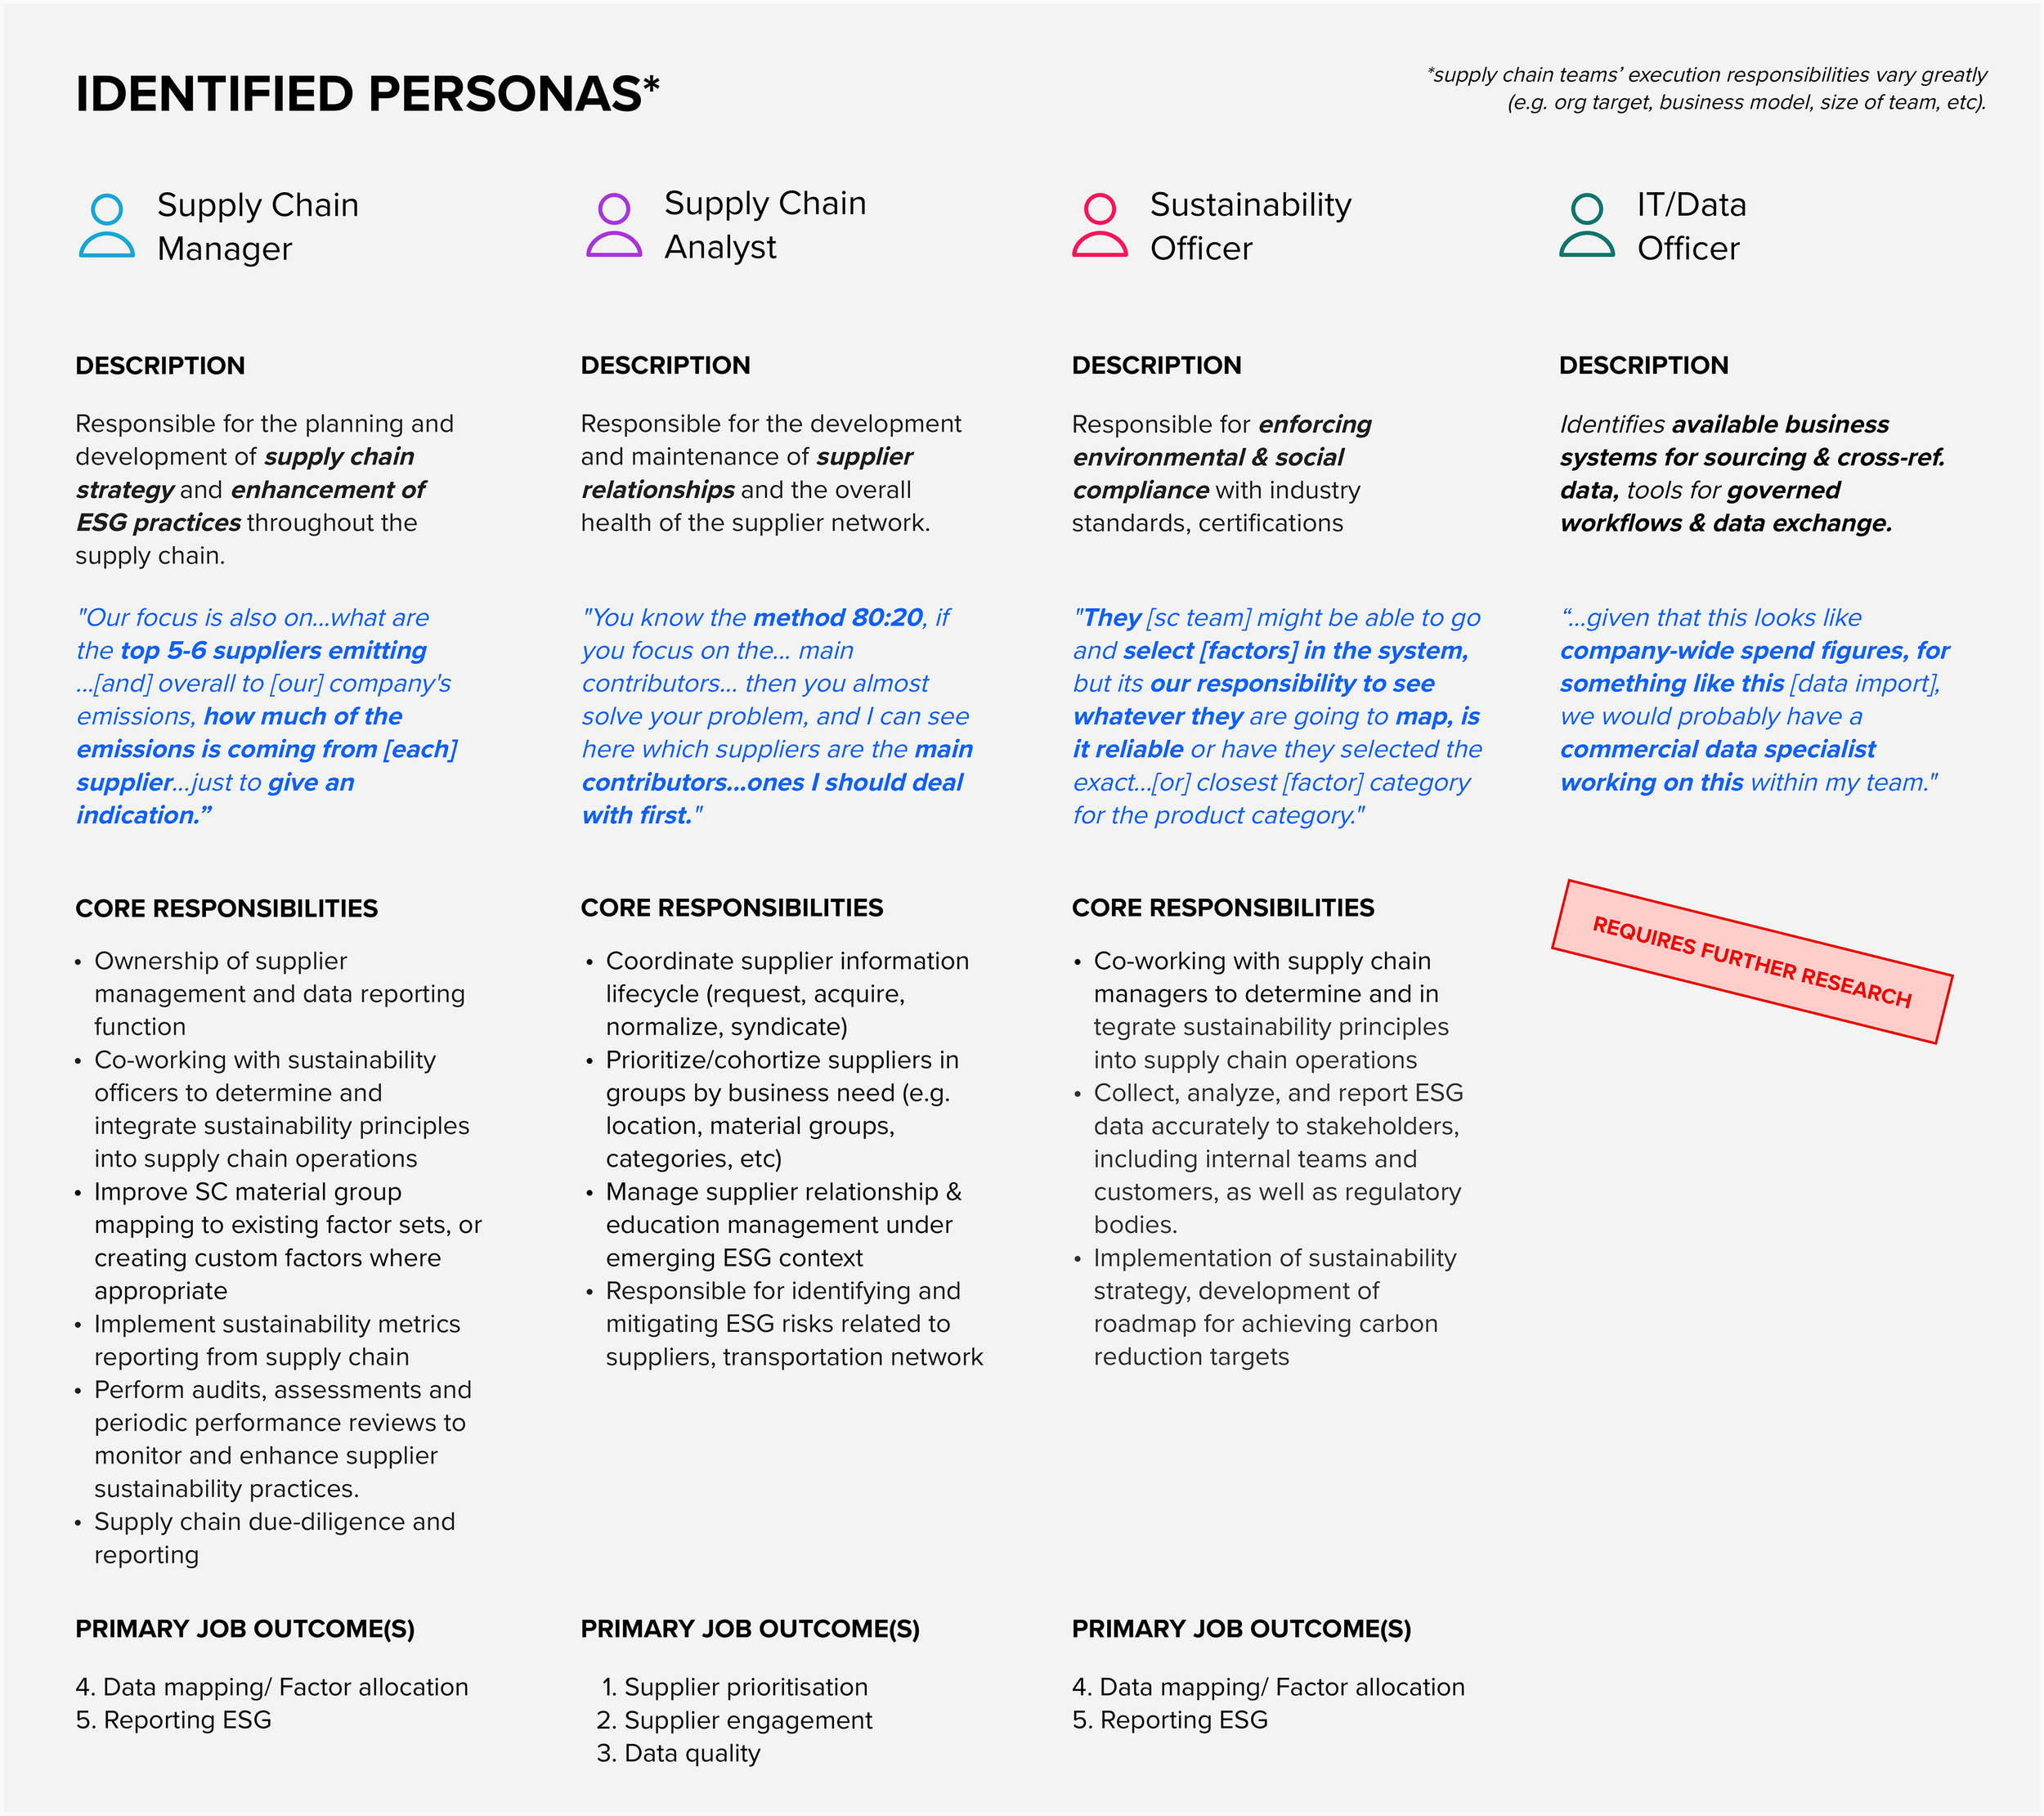
Expand on persona research to further delineate the use cases, interactions of SC & ESG roles, & accountability for responsibilities
External assessment of external company/user current data readiness, systems utilisation & perceived net zero status journey
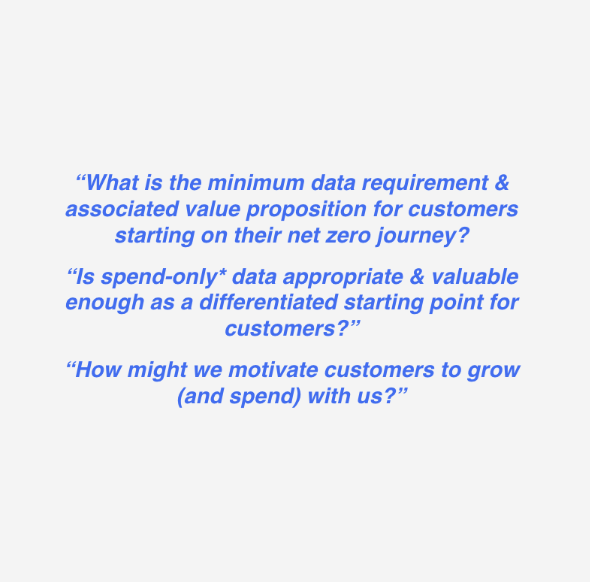
External validation from representative users on potential minimum data requirements & associated value propositions
Unified UX concept in/validation from relevant SMEs with sample business value use cases.
Methodology
While considerable role and journey discovery was required via 1-1 qualitative interviews, reviewing the methodology with other researcher peers highlighted the need to tie this discovery with a more tangible output that the product team could visualise acting on immediately for the MVP, which is why the concept testing method was introduced.
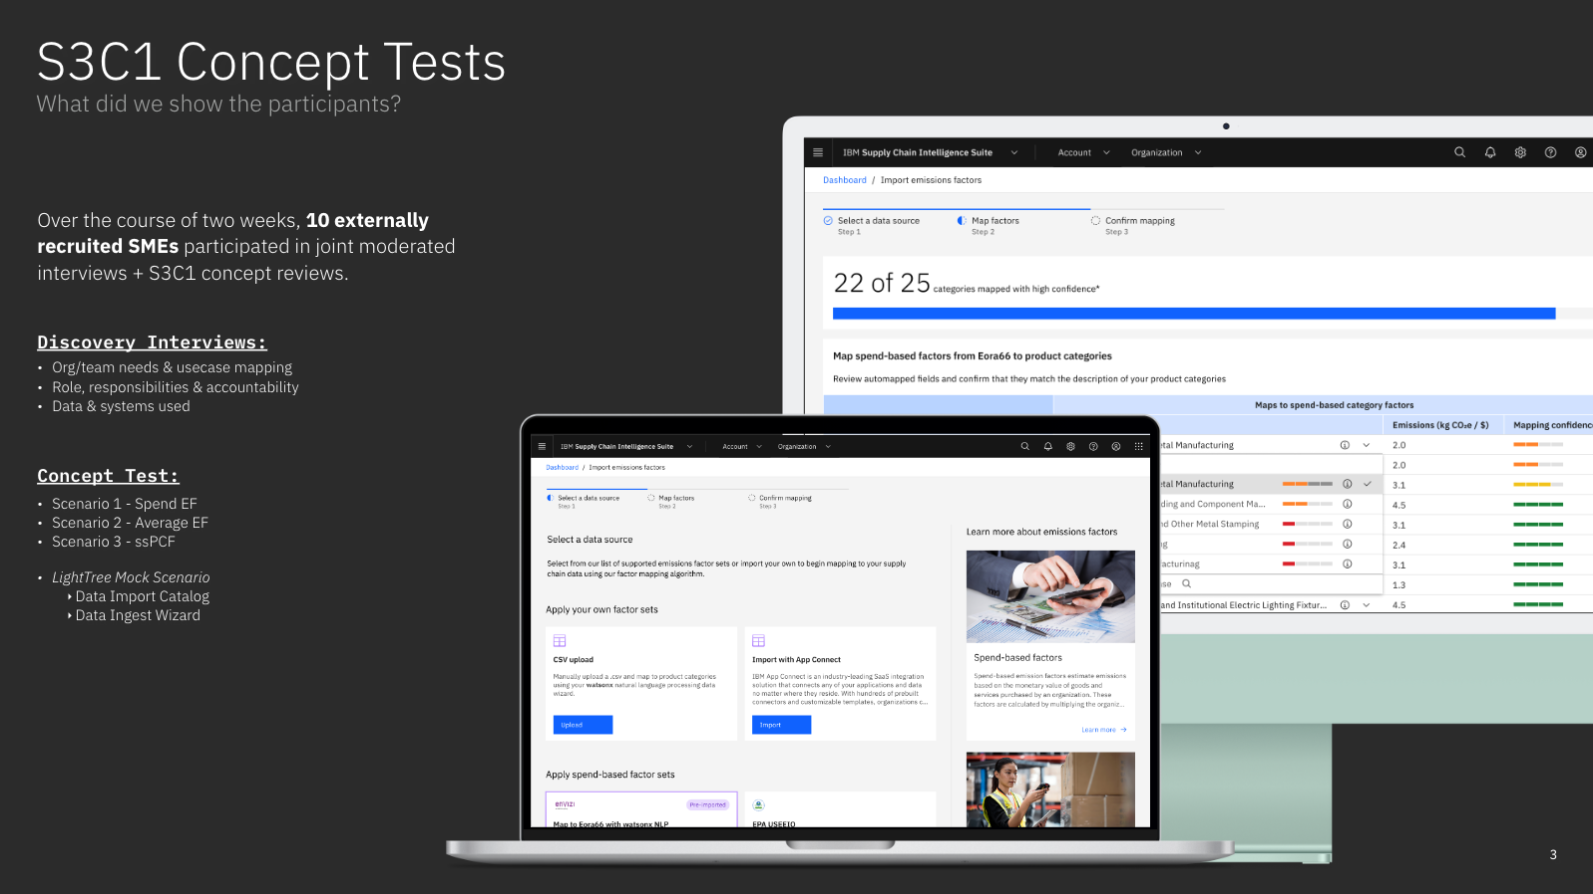
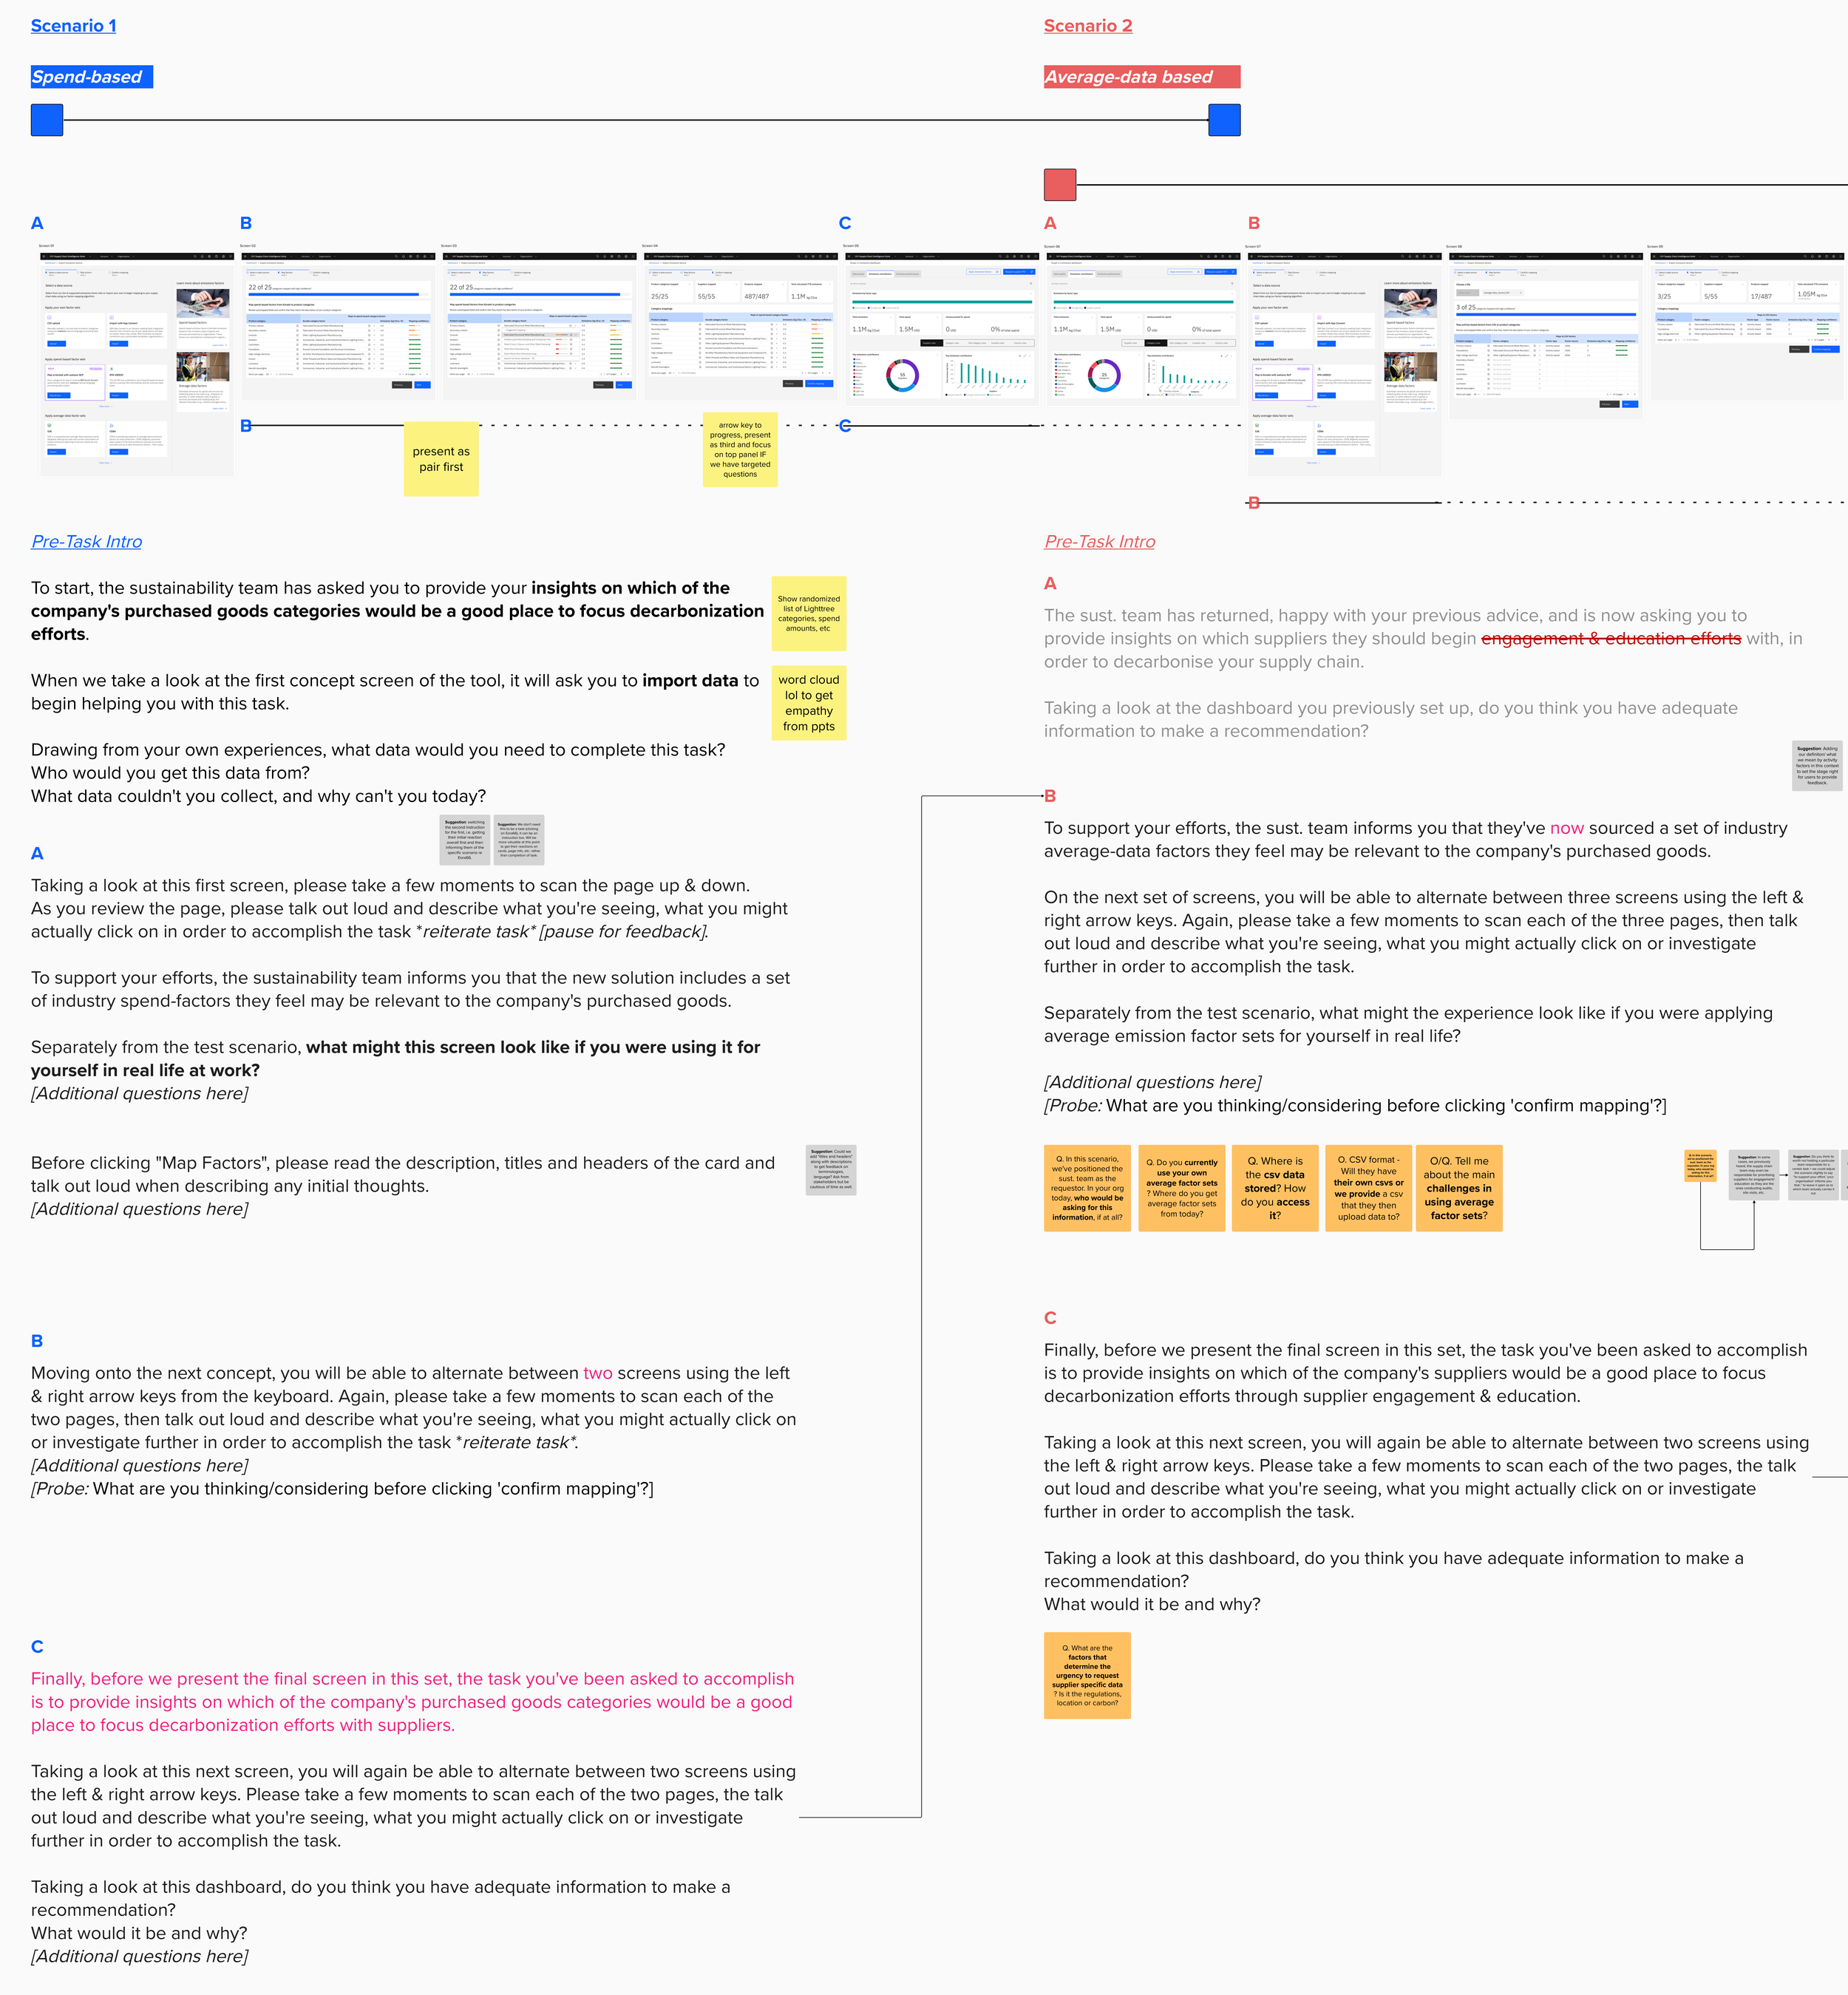
Concept Test Plan
Concept themes (co-created with Design & Research and reviewed with PM) emerged from internal dissent around which 'Product Carbon Footprint calculation method' would be most valuable to prospective customers to start and grow their 'Scope 3 Sustainability' journey with IBM.
Design thinking workshops leveraged future scenarios to inform concept visions that facilitated participants (in)validating various IBM POVs on specific areas of the “ramp” to Net Zero.
Stakeholder Feedback
Myself and the other Lead UXR ran a feedback session in order to review the shortlisted participants before inviting them to the study, the research questions and discussion guide, as well as concepts and testing scenarios.
This was crucial to ensuring alignment in the research approach across two stakeholder groups and product teams, and securing buy-in before launching the study.
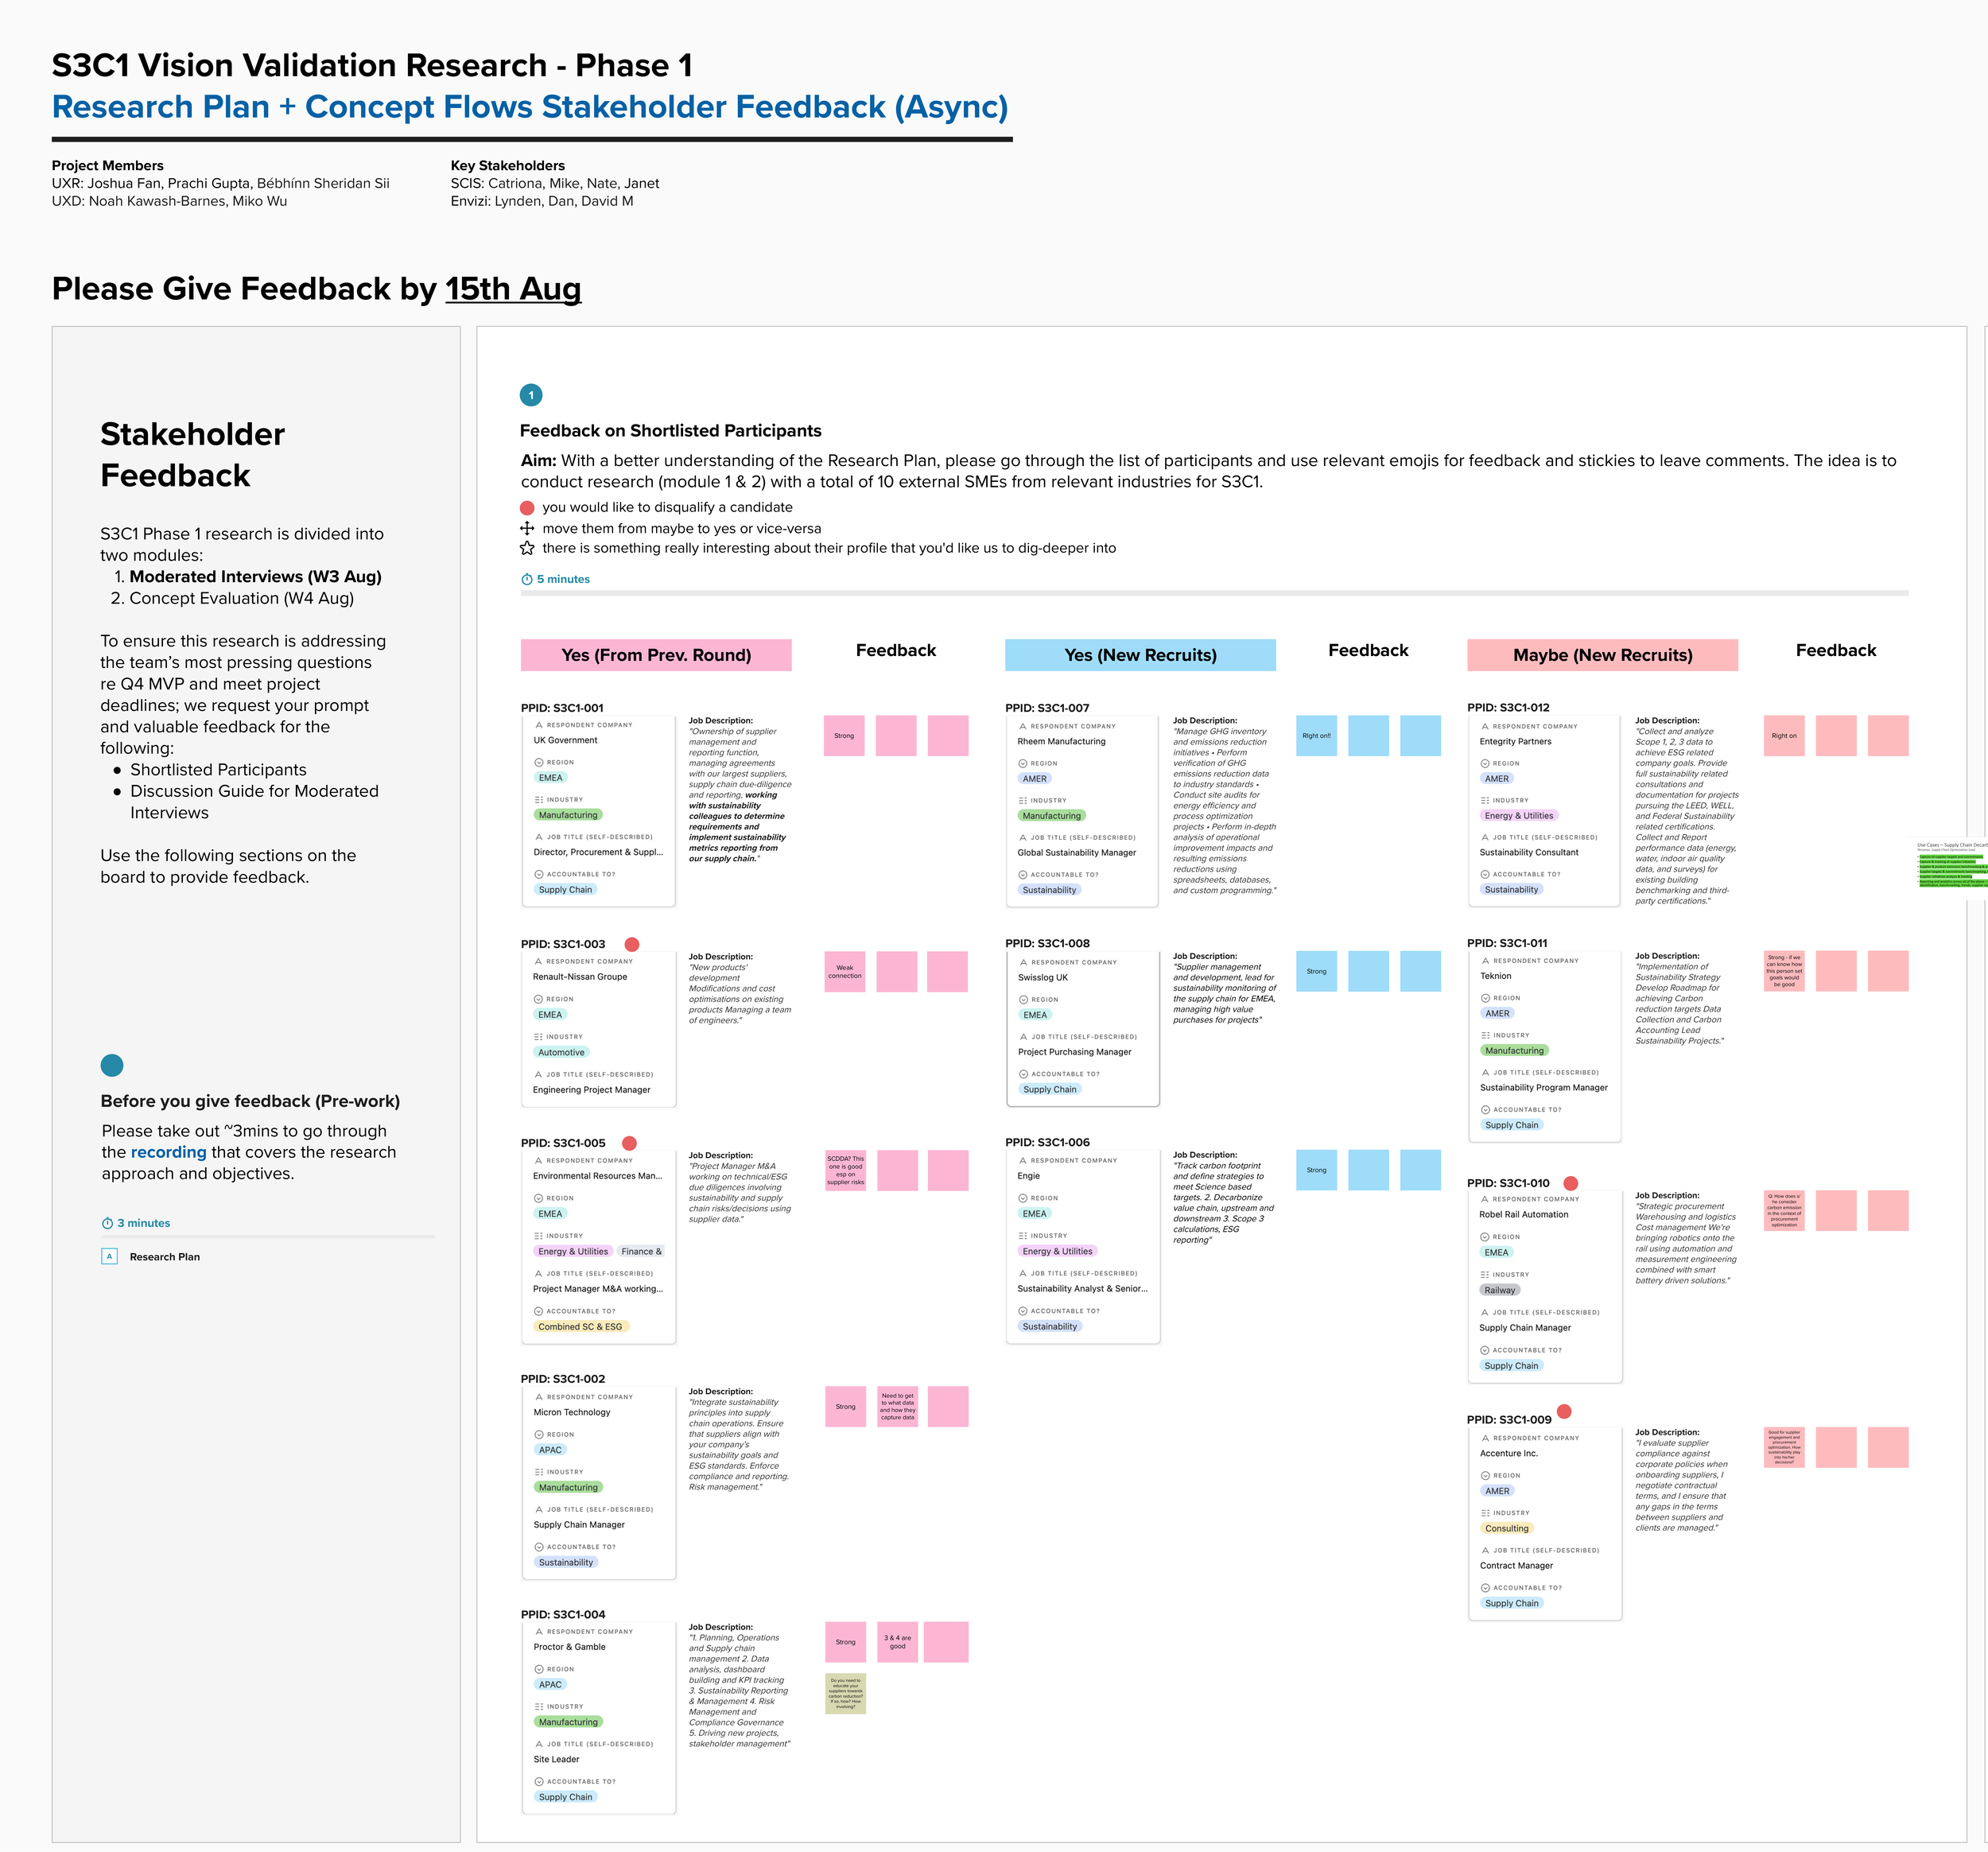
Shortlisted participants
Feedback highlighted from the session:
The need to validate concepts with true decision-makers (e.g. procurement, sustainability, finance), not just downstream data consumers
Stronger emphasis on testing actionability and decision impact, rather than high-level vision appeal
Recognition that Scope 3 Category 1 ownership, workflows, and journeys are non-linear and role-dependent, requiring clearer role discovery upfront.
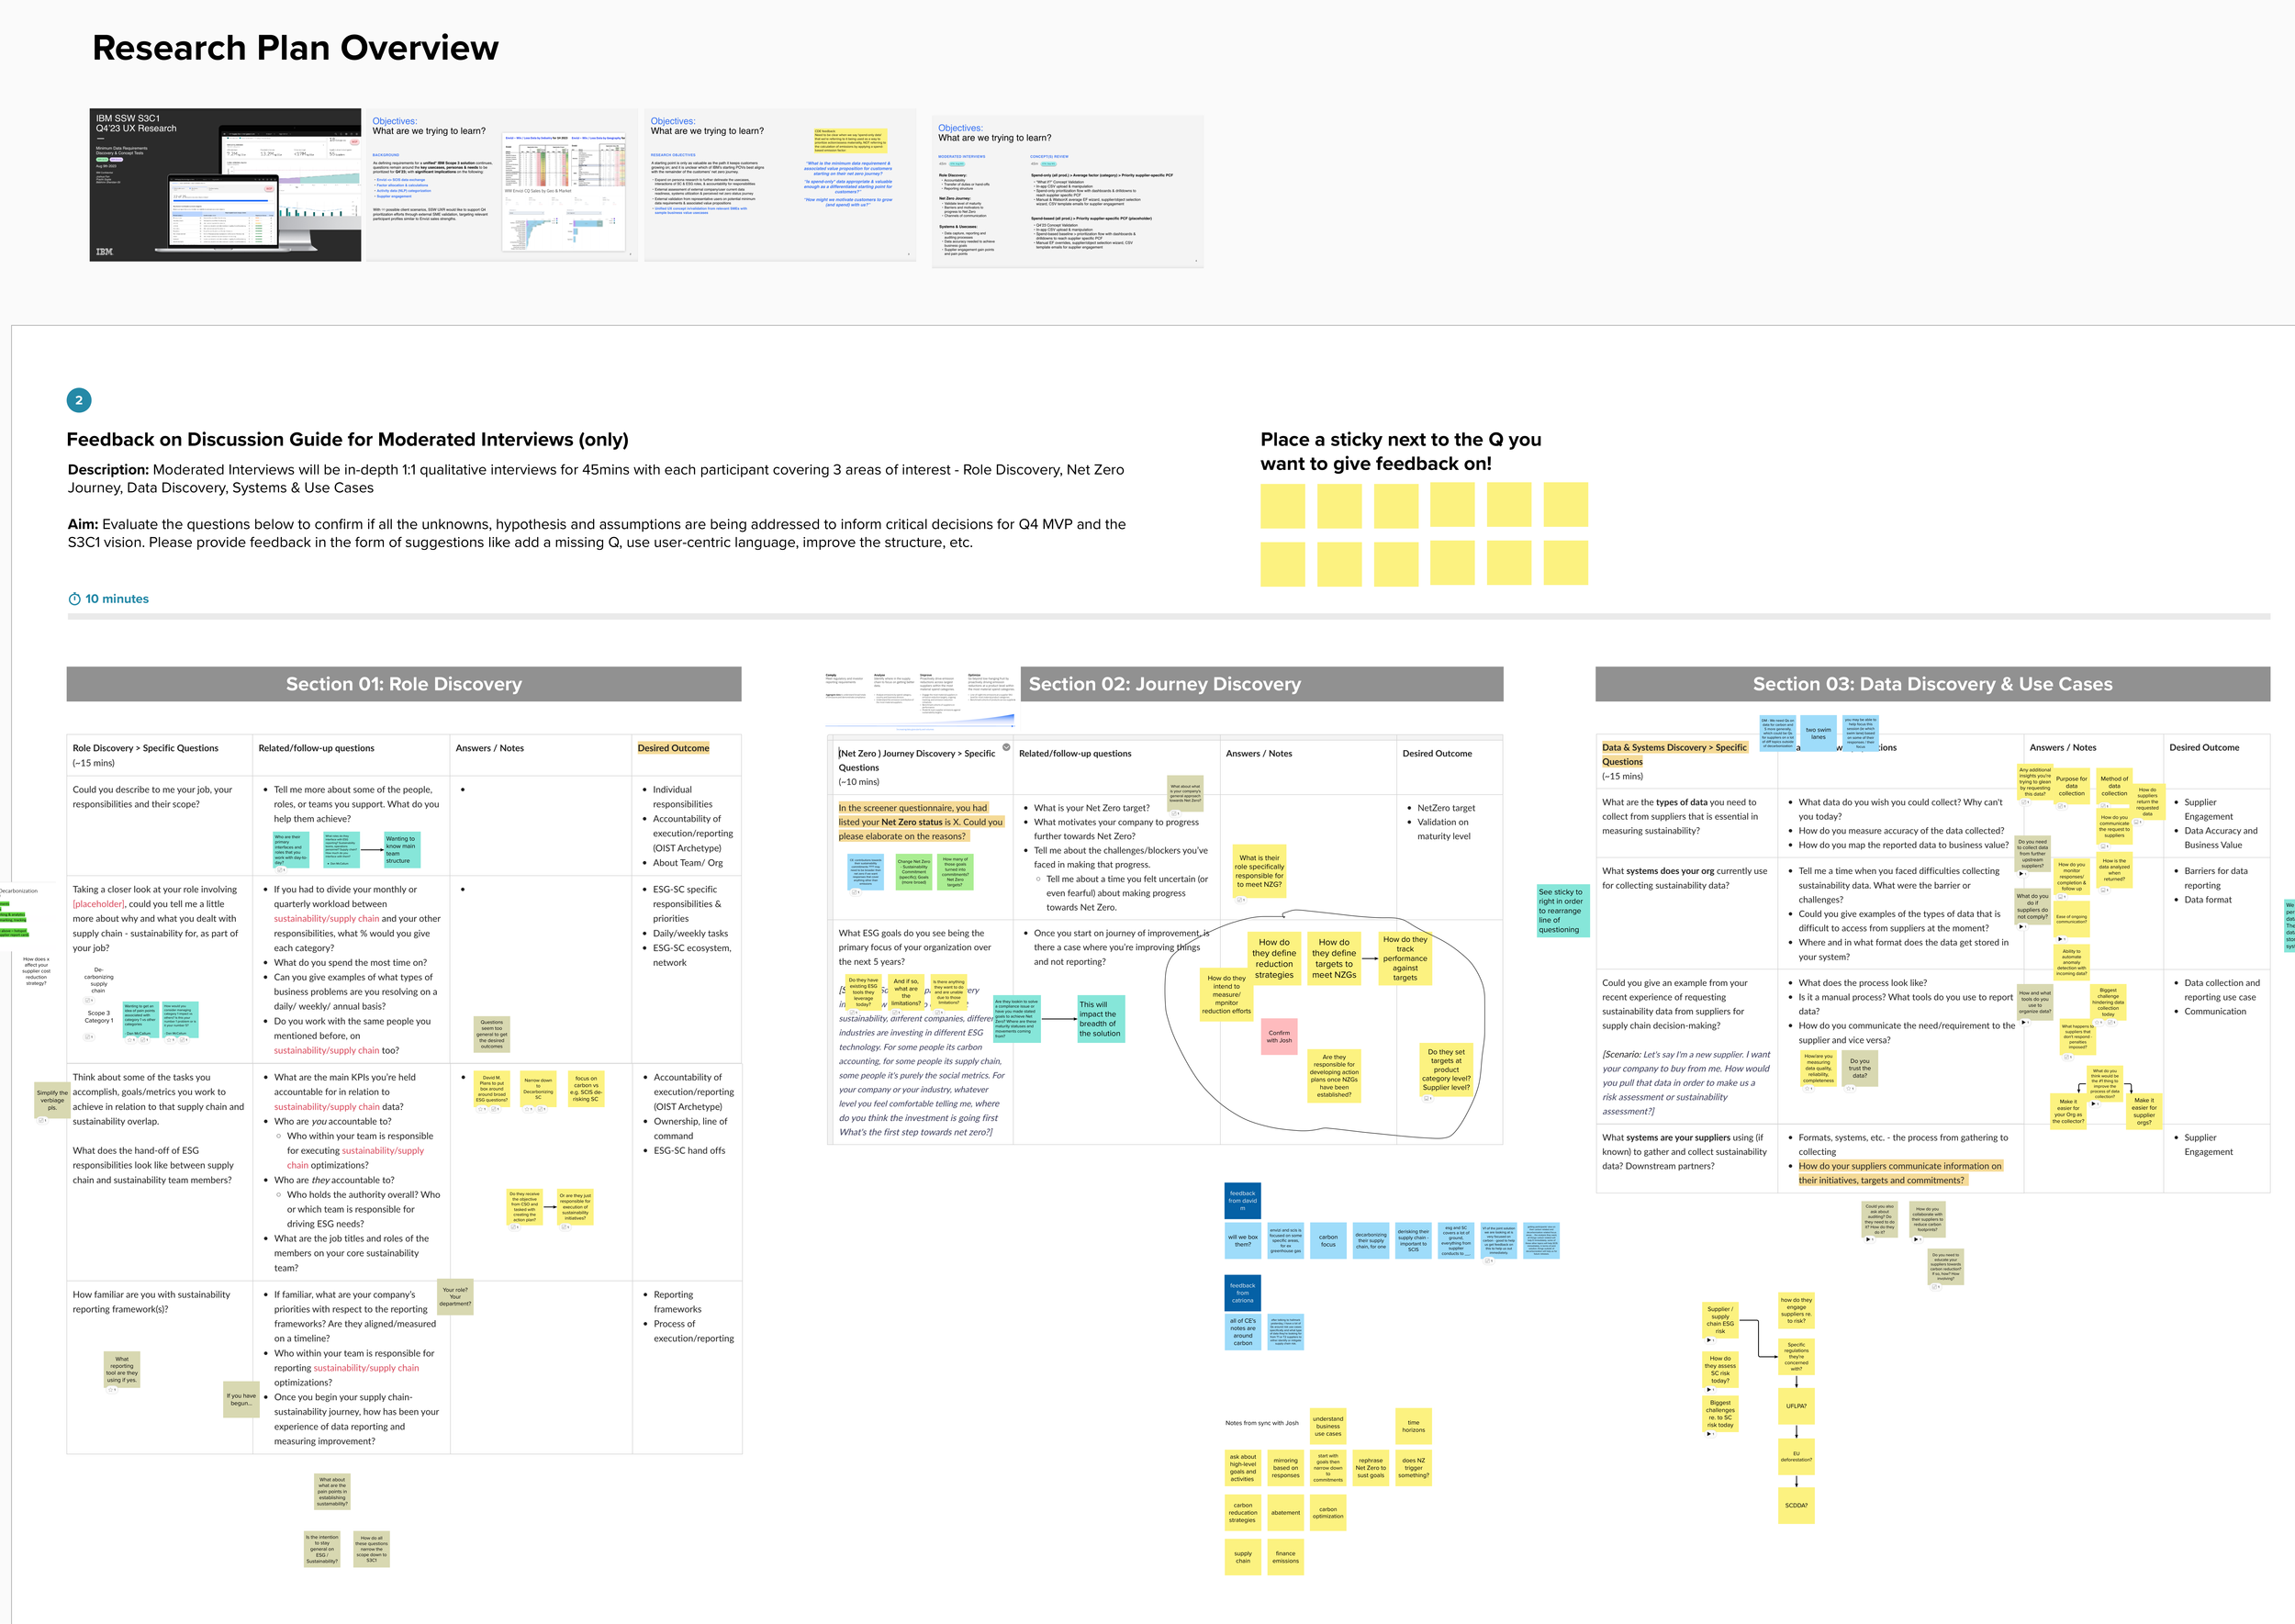
Research plan & discussion guide
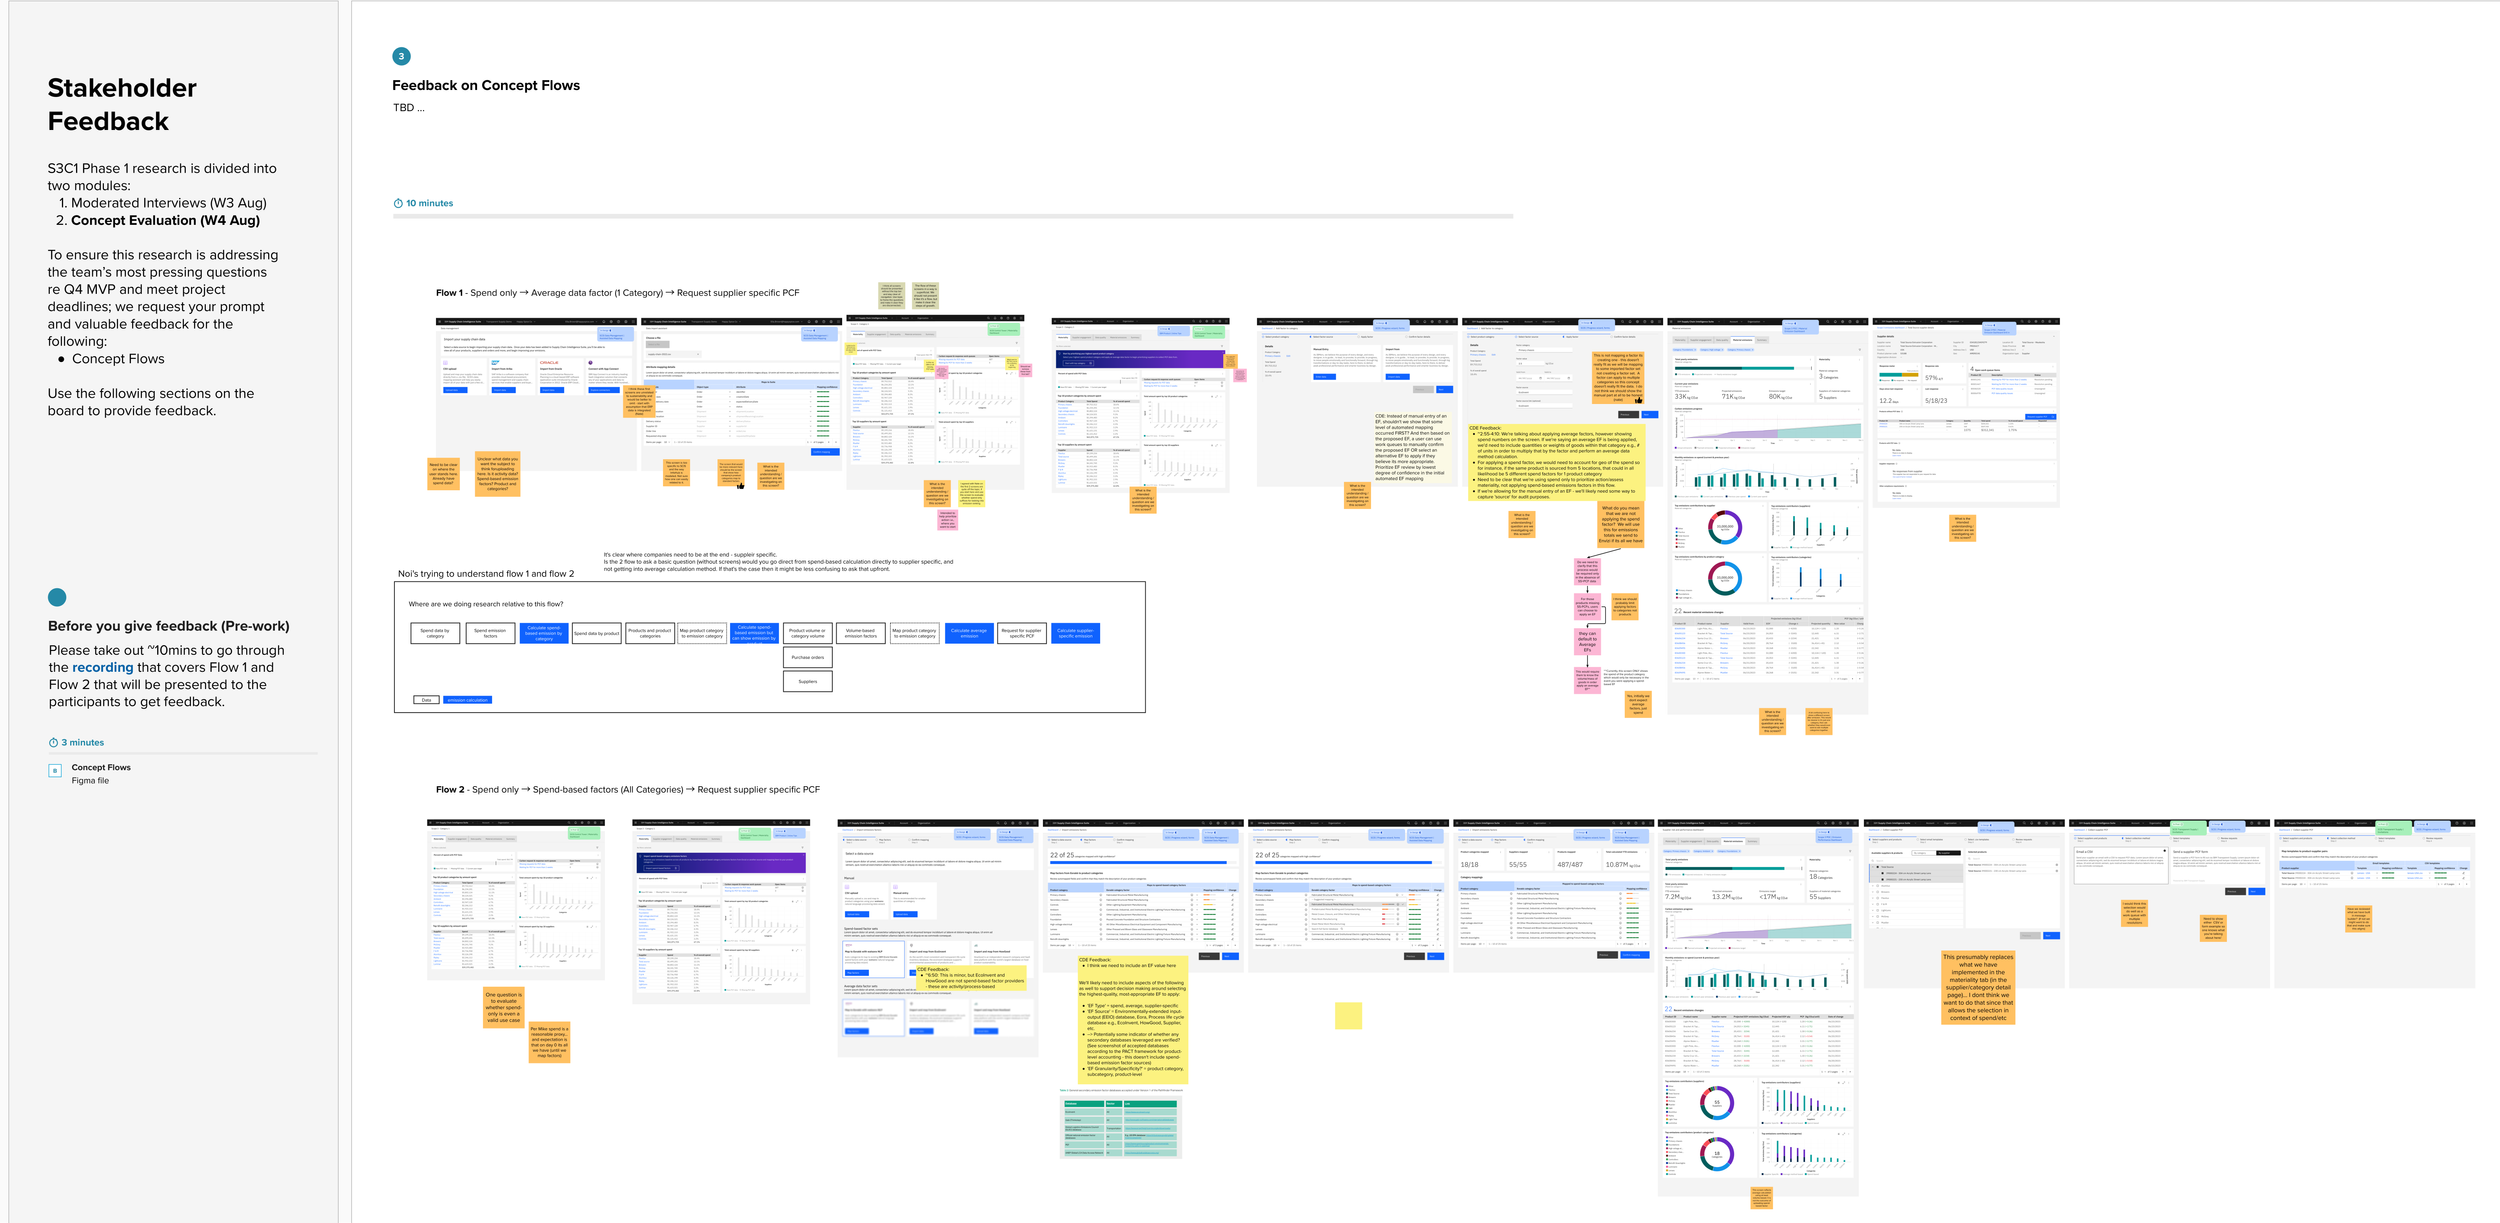
Concept screens & scenarios
In-flight Research Updates
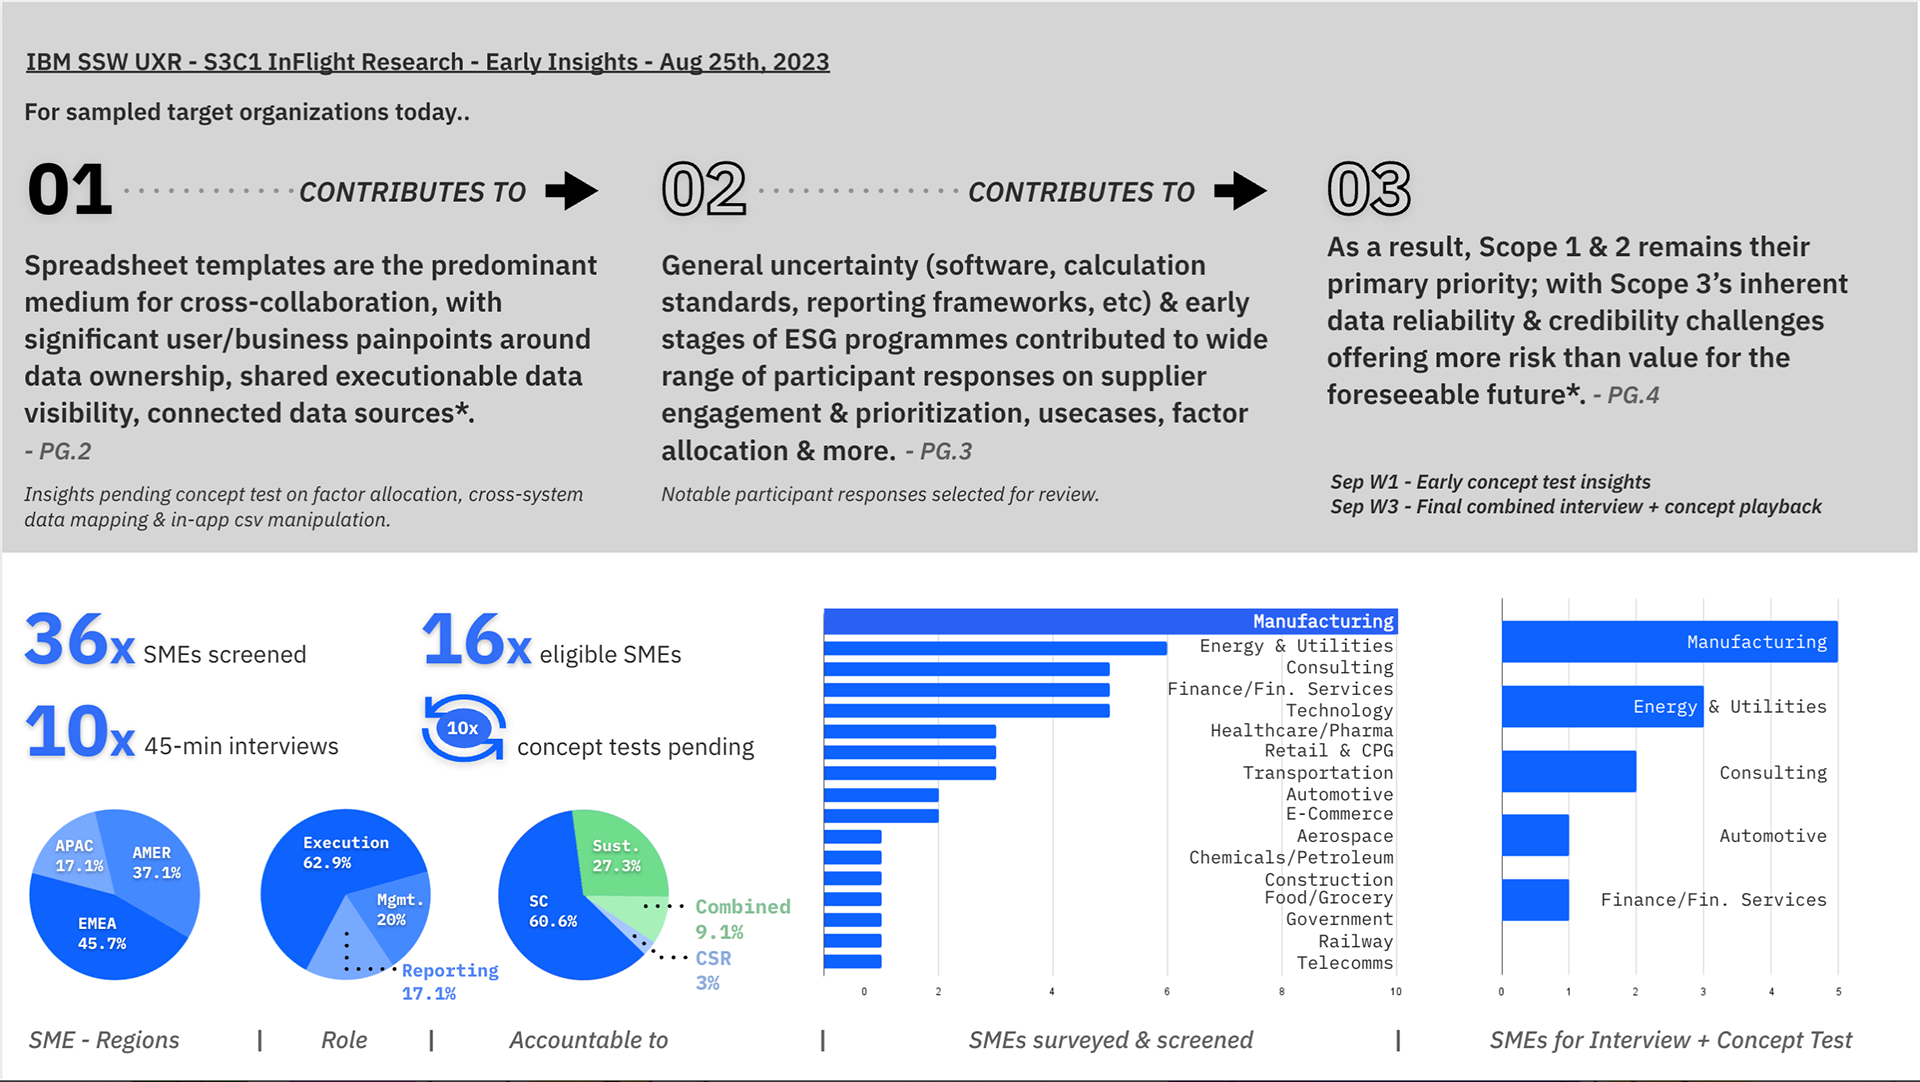
With this research study spanning across two product suites and senior stakeholder groups, enhancing research visibility through creative in-flight study updates was crucial to keeping Research active in product decision conversations.
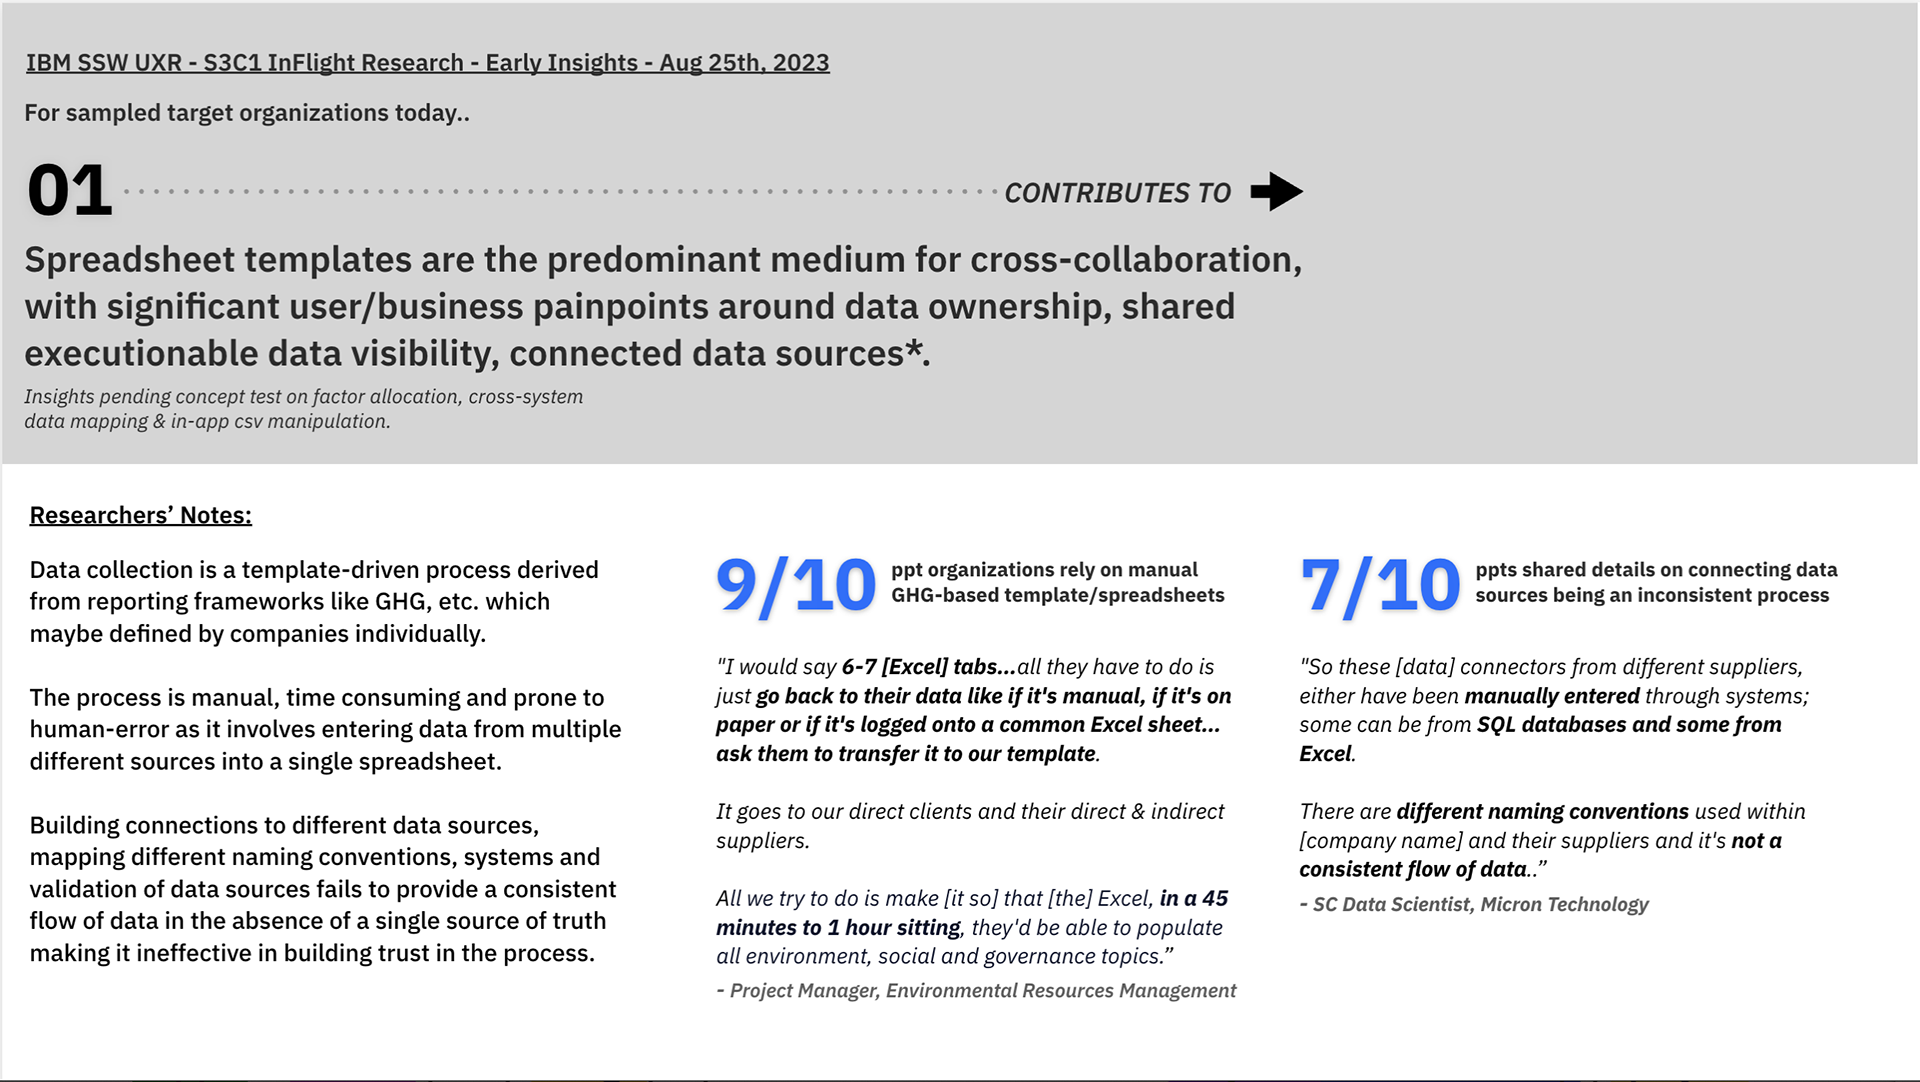
Sharing these high-level insights and emerging themes via Slack generated interest and engagement from stakeholders; and their questions in response to the findings became a focused lens for us to synthesise through later.
Analysis & Synthesis
Collaborative analysis
I collaborated with two other UXRs to analyse 10 interviews and concept tests, and synthesise a lot of qual data under time pressure.
We took a structured, bottom-up approach to start. I began with affinity clustering to identify patterns and themes emerging directly from participant data, allowing insights to form without imposing predefined assumptions.
Affinity clustering
From these clusters, I distilled detailed findings and then cross-referenced them against the original research questions, the discussion guide, and stakeholder feedback gathered during in-flight research to ensure alignment and coverage.
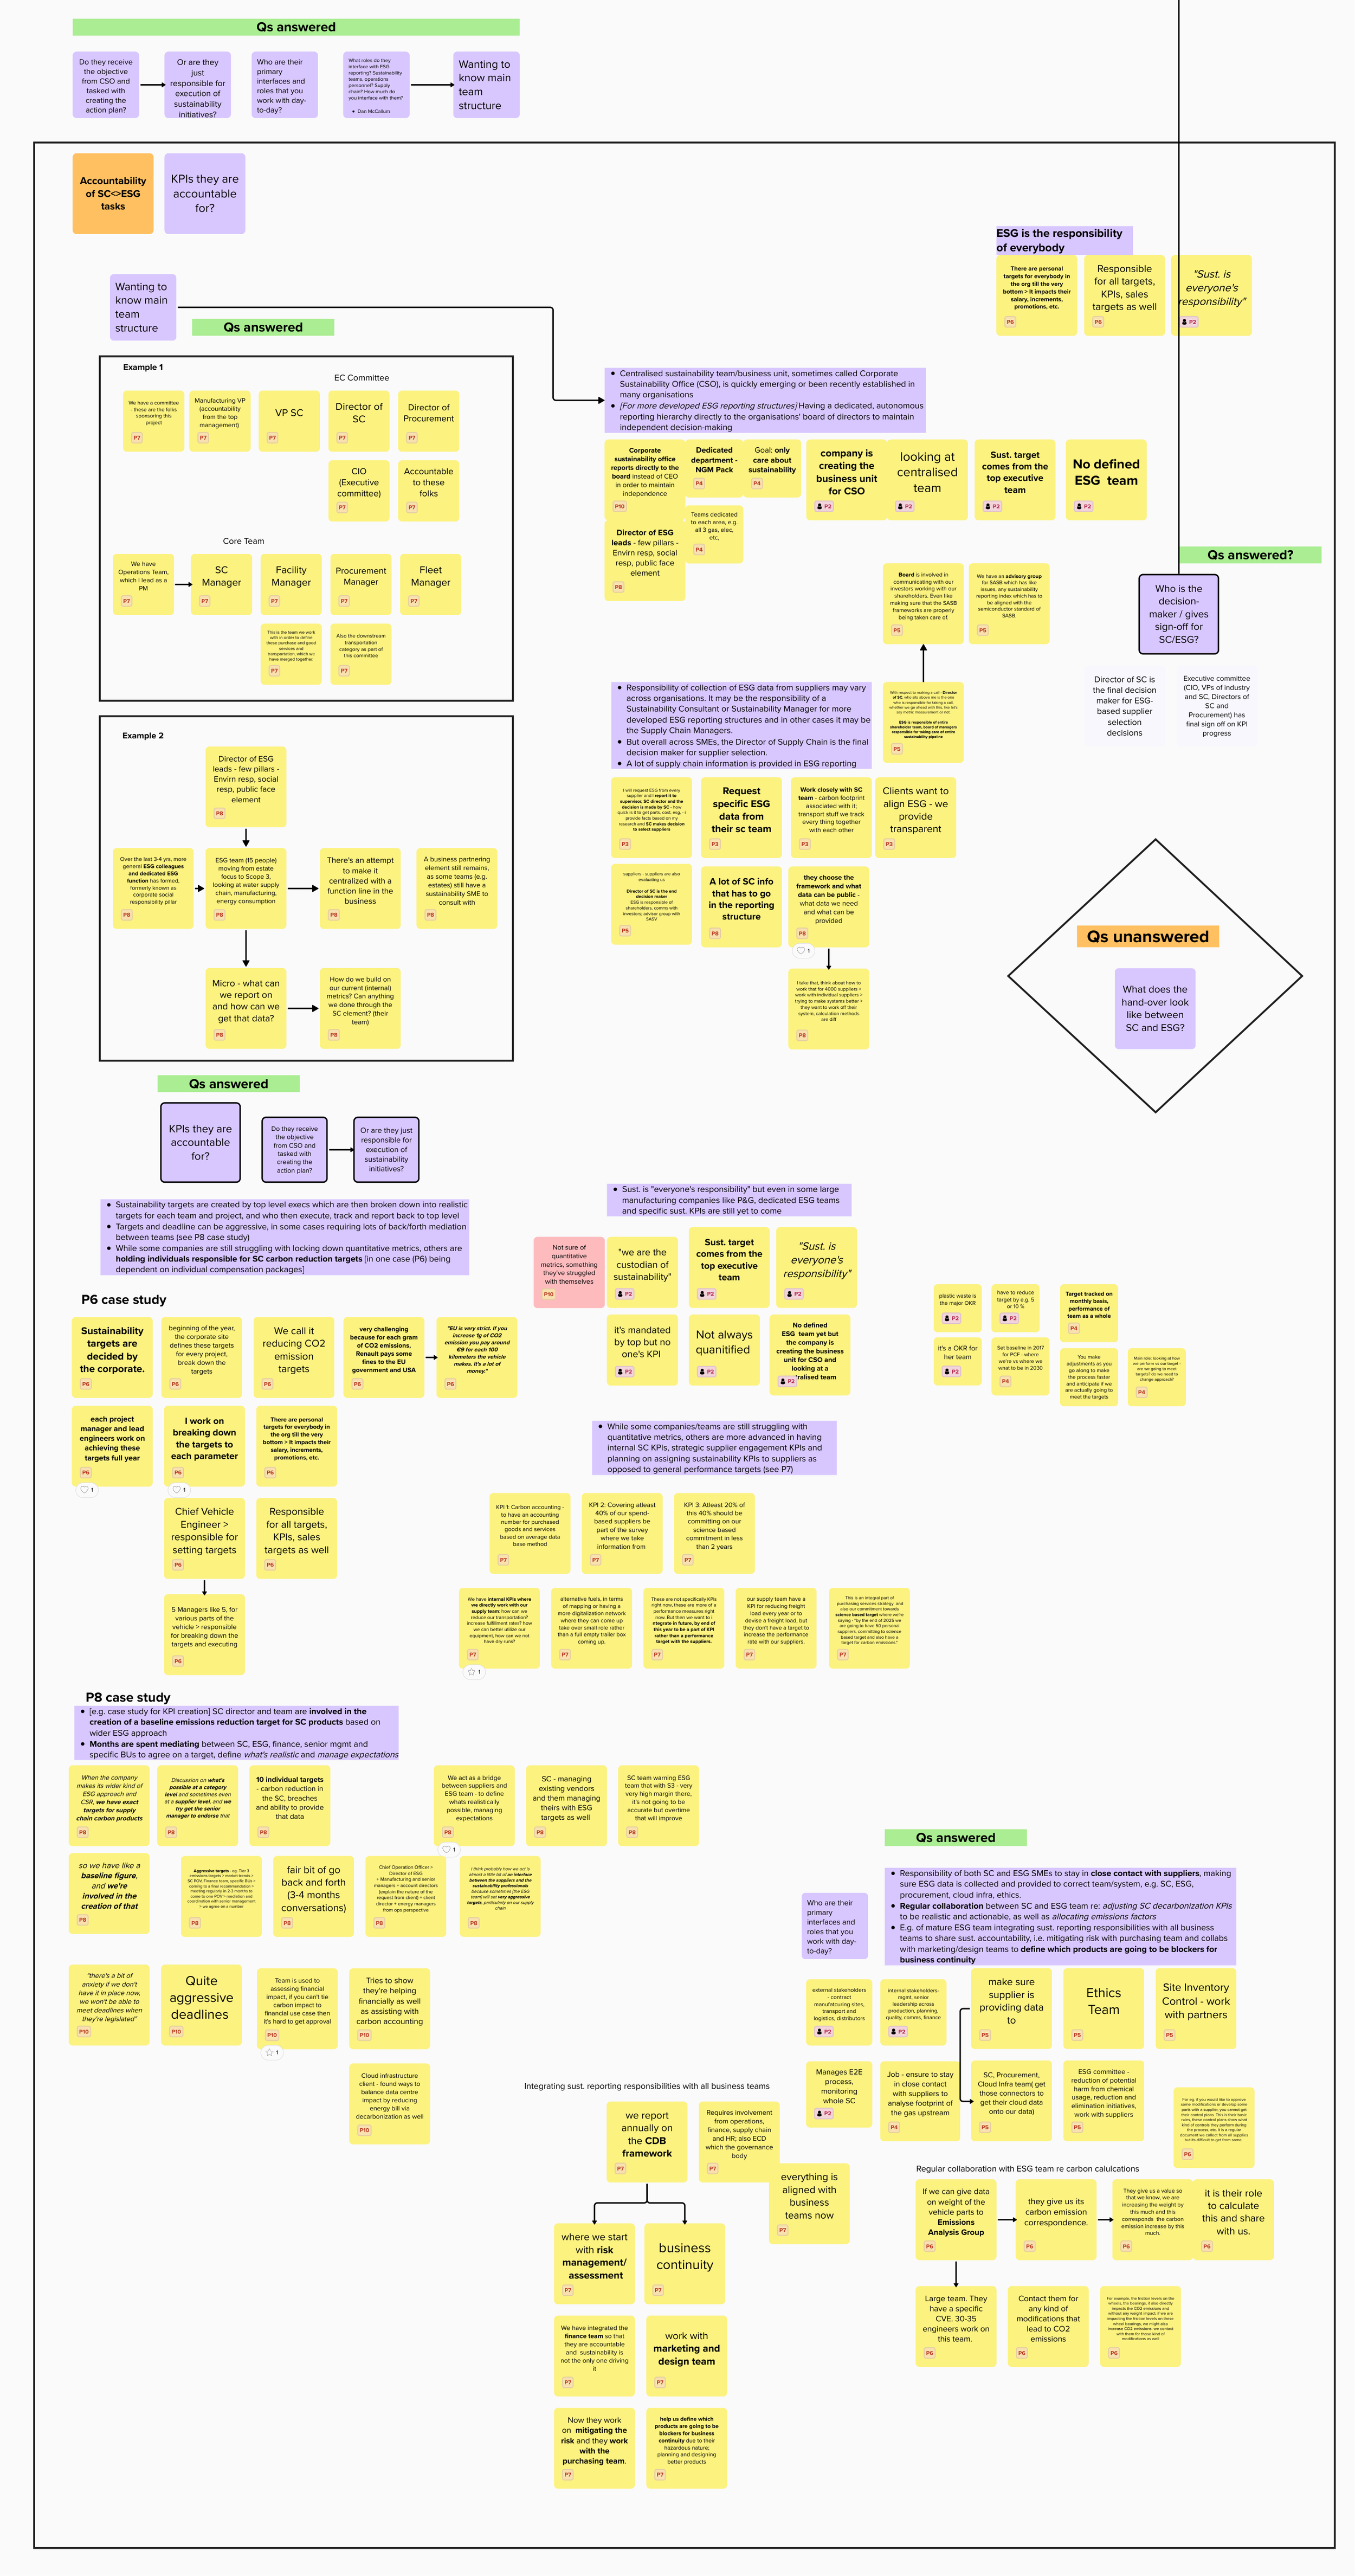
Finally, we organised the outputs into questions answered, questions unanswered, and emerging themes, creating a clear narrative that highlighted validated insights, remaining uncertainties, and new areas for future exploration.
Adjusting synthesis scope
While the data yielded rich qualitative insights, the scope of data collection proved too broad, spanning multiple knowledge gaps and product themes.
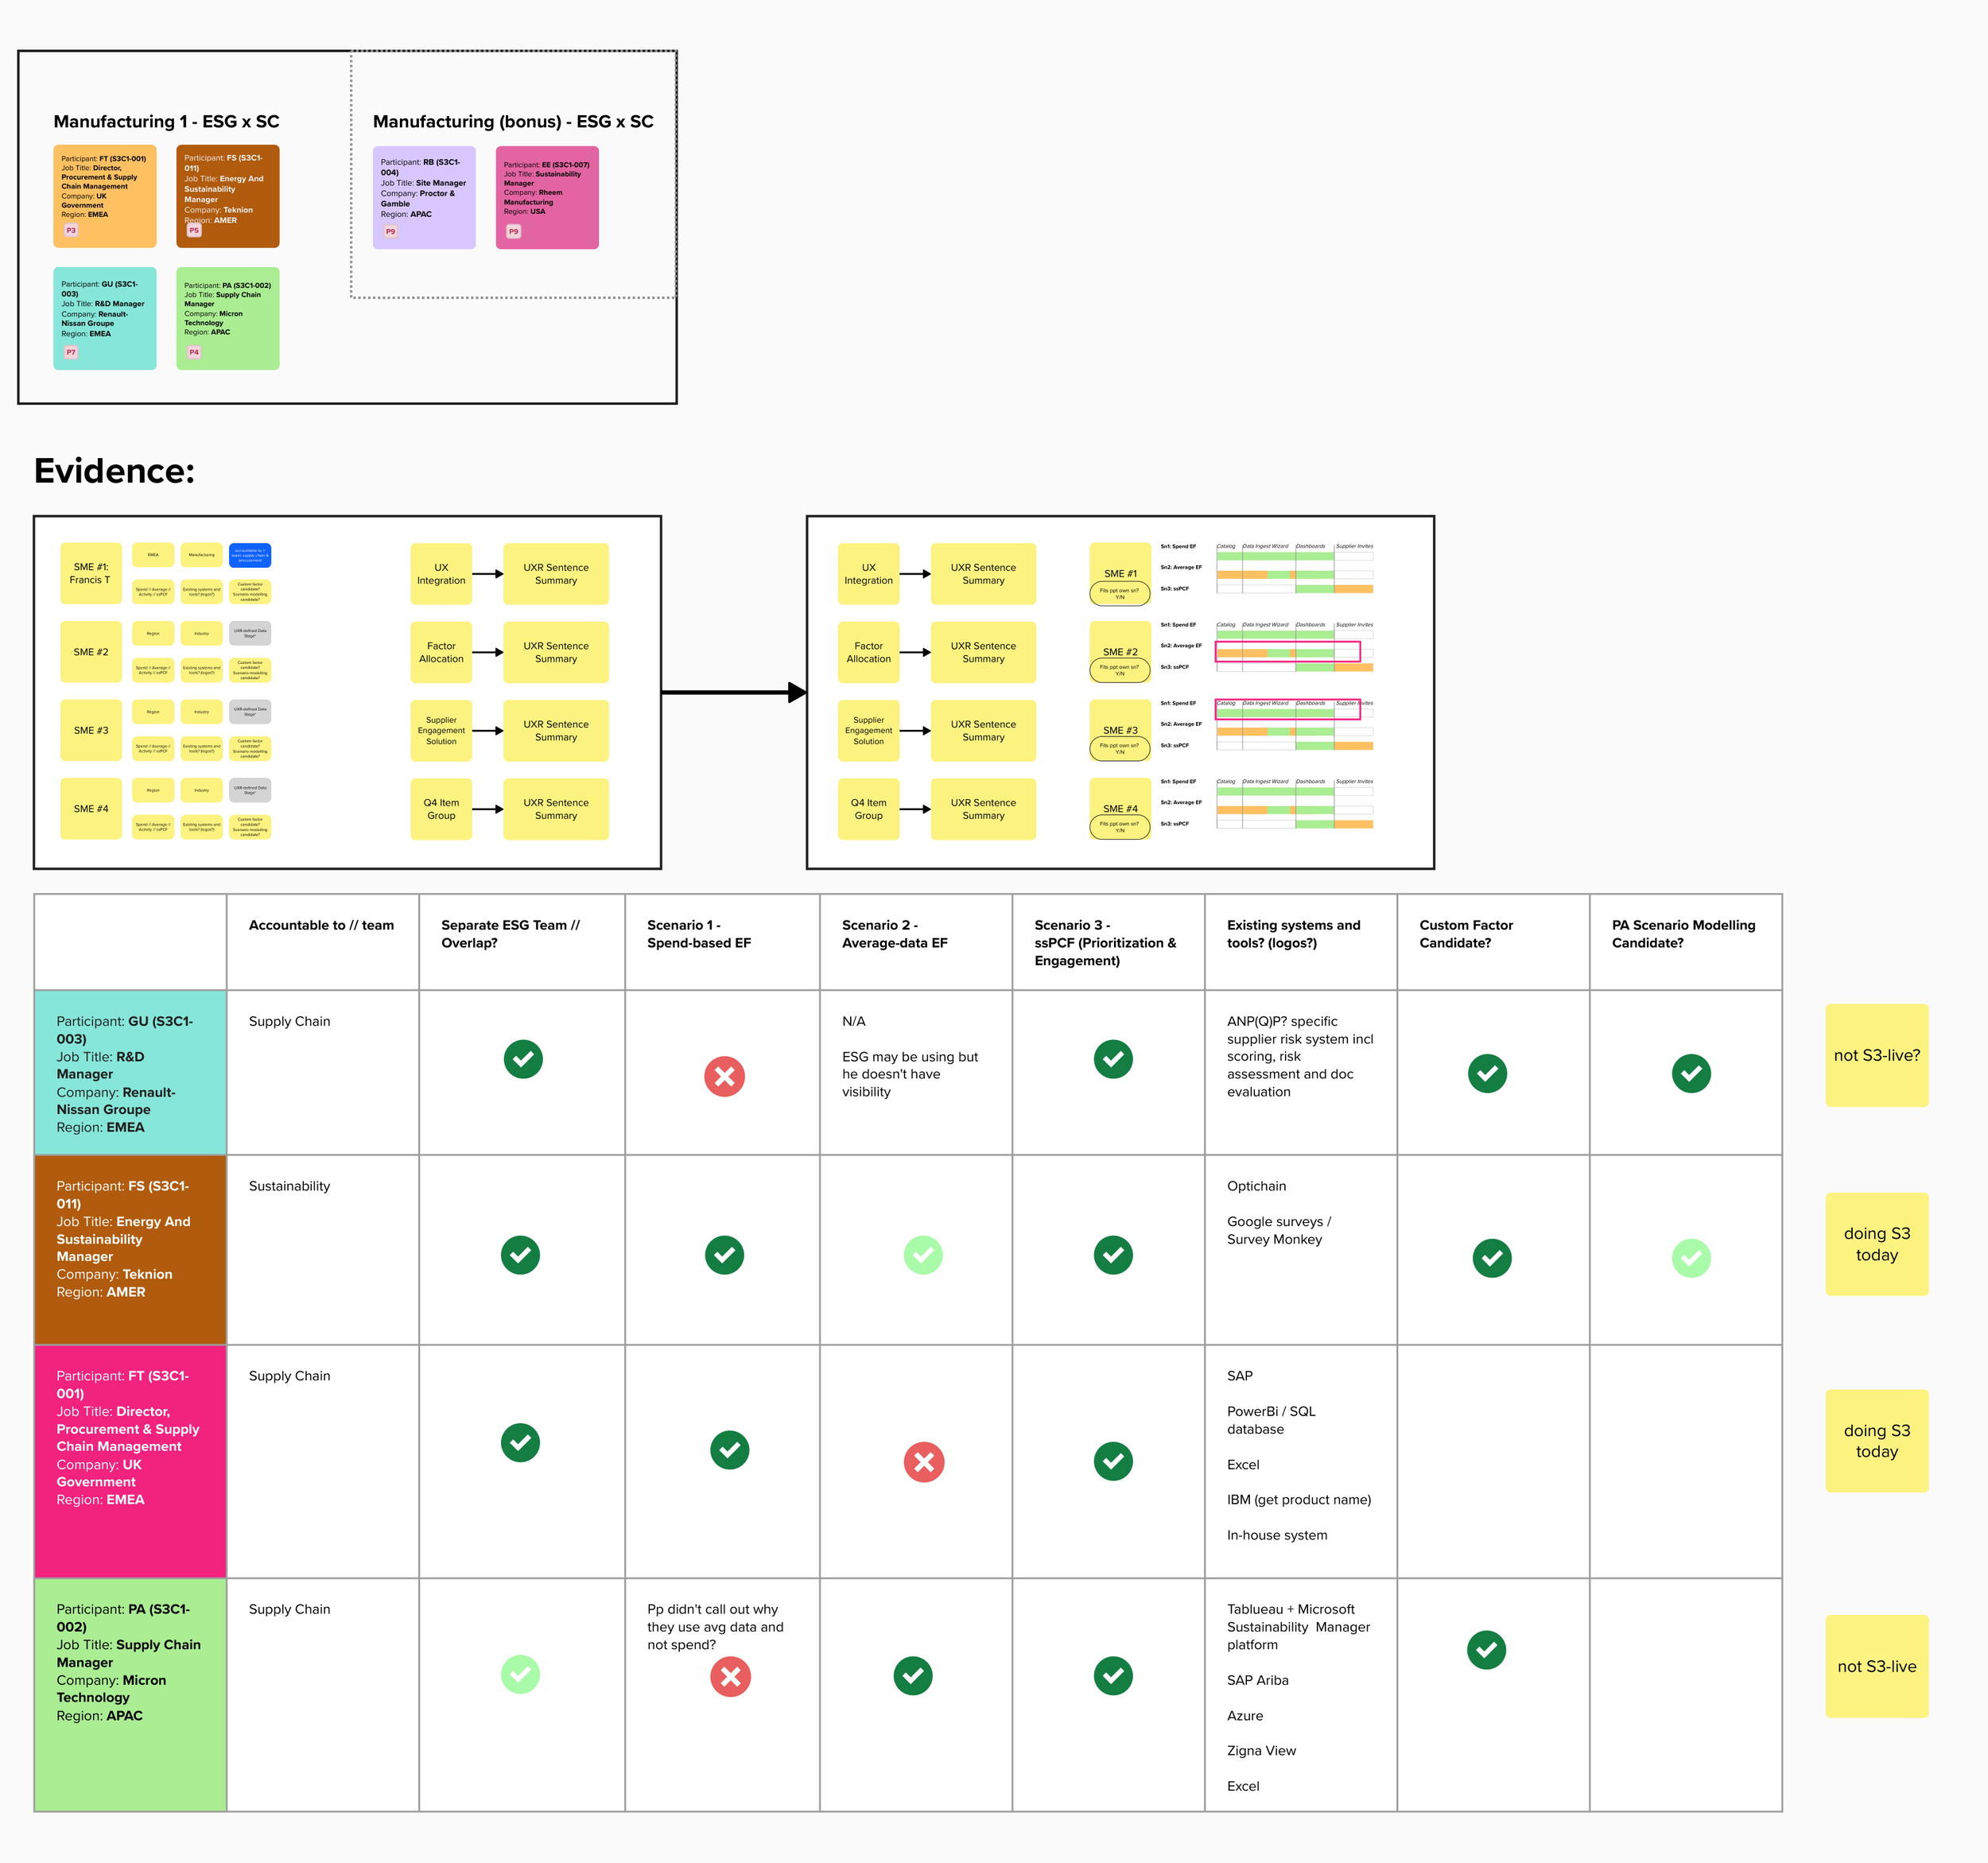
Following initial synthesis, we observed divergent findings across industries. Given the tight timelines for committed deliverables, we aligned on narrowing the focus to a single industry—manufacturing—which showed the strongest evidence of unmet user needs directly related to the Scope 3 Category 1 capabilities being developed for the MVP.
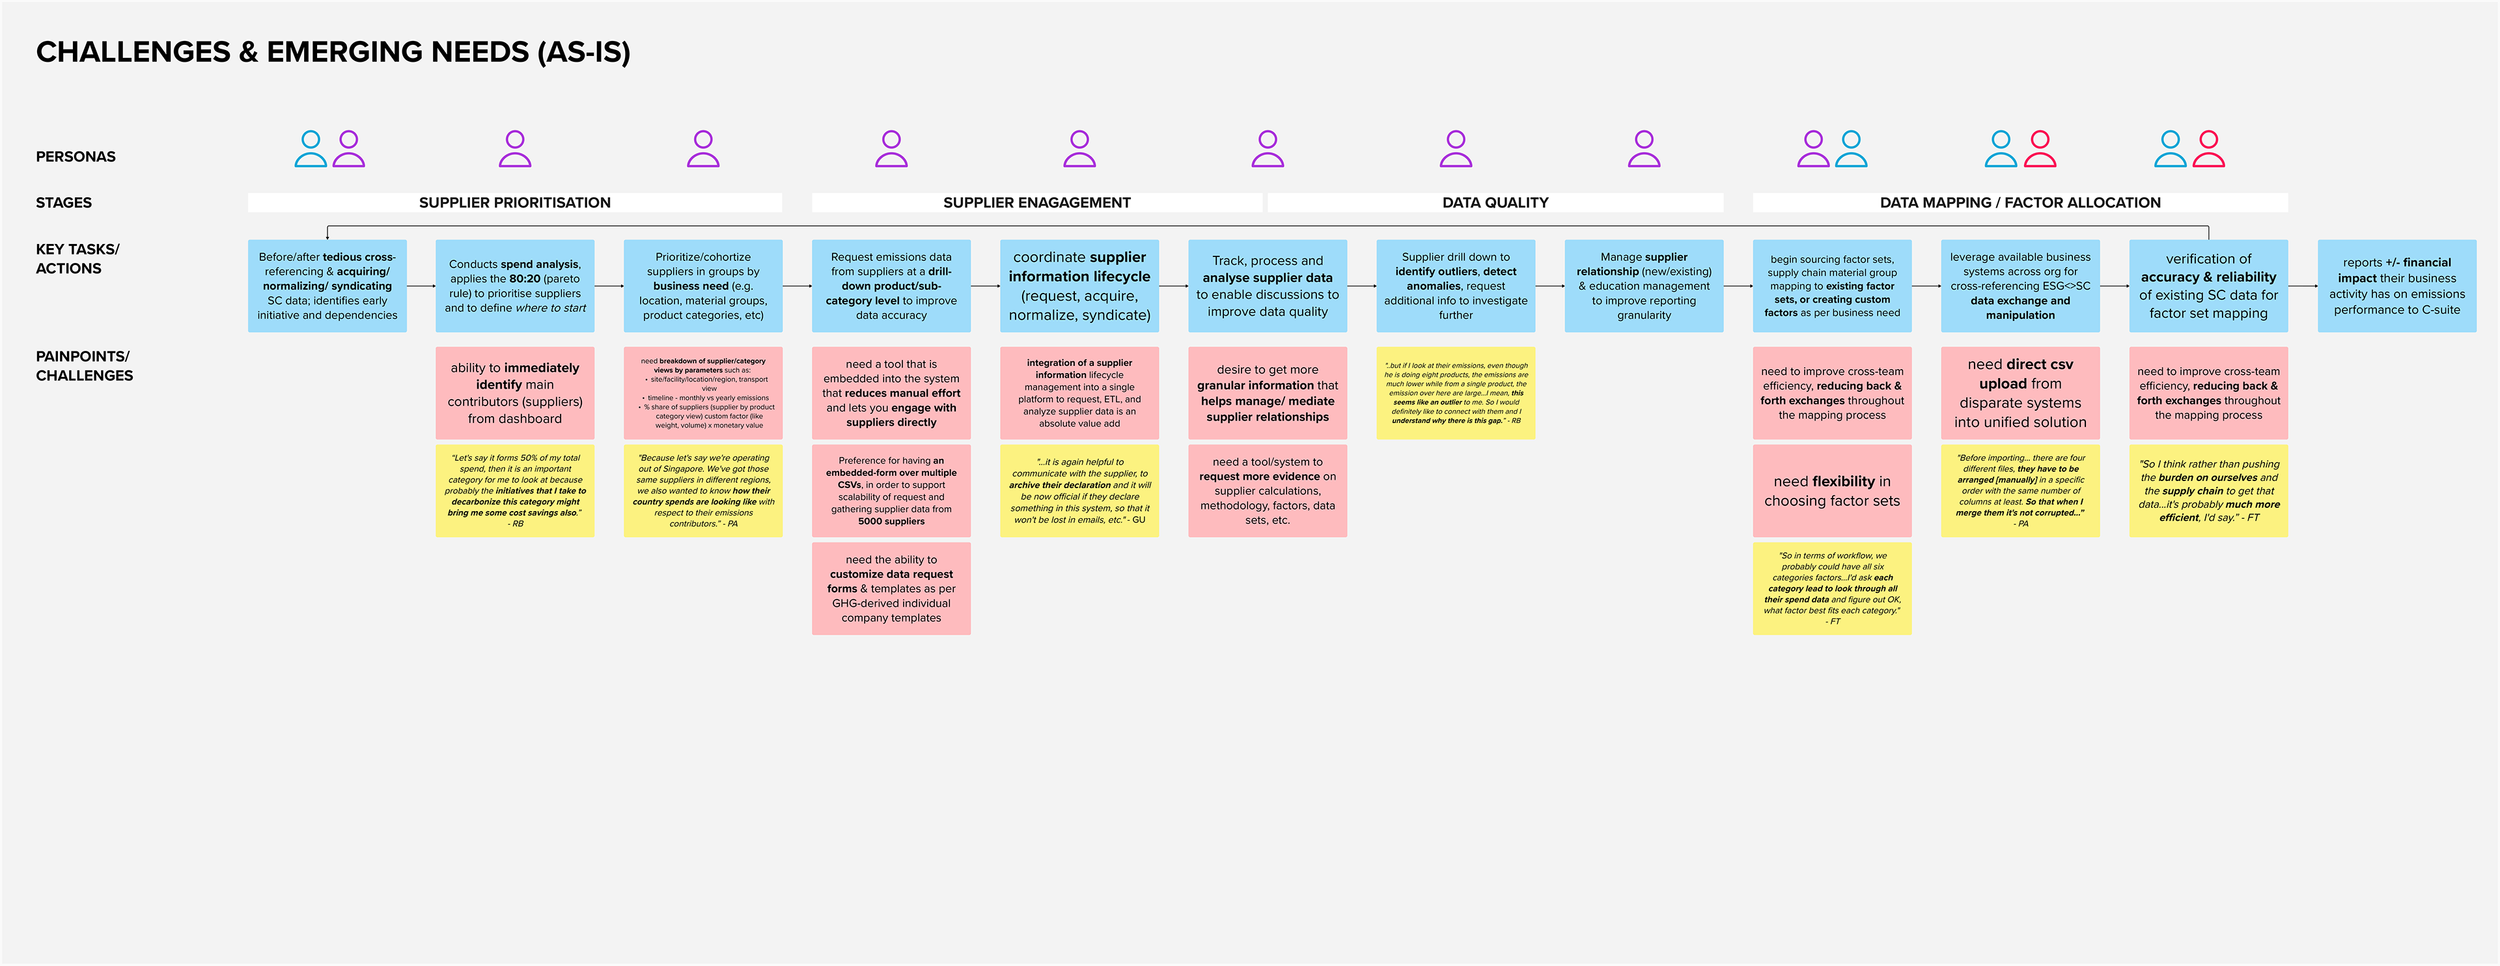
Personas & Emerging Needs
Building out emerging persona needs across their as-is journey revealed that sustainability efforts are heavily constrained by misaligned mental models, inconsistent data practices, and siloed workflows across supply chain and sustainability roles. While all personas share responsibility for ESG reporting, they lack a unified decision framework, shared data model, and coordinated workflow for supplier prioritisation, supplier engagement, and emission factor mapping.
As a result, sustainability accuracy is dependent on supply chain processes that were never designed with ESG intent, and supply chain efficiency is slowed by ESG requirements that feel disconnected from operational reality. Aligning both groups requires reframing ESG not as an add‑on, but as a shared lifecycle embedded across supplier management.
Research Playback
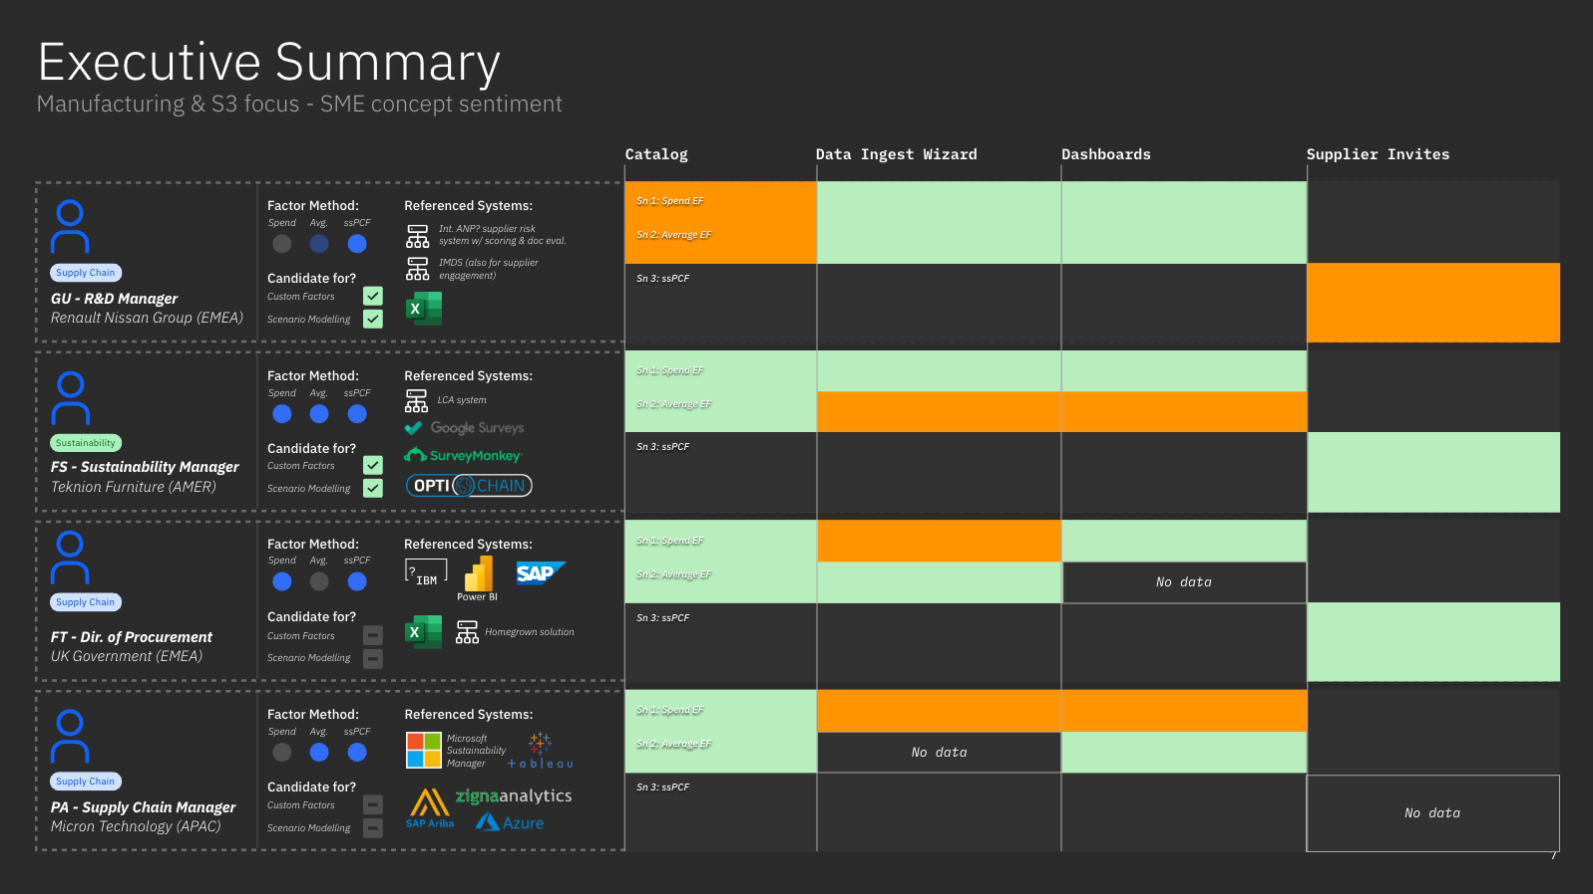
This executive summary synthesises insights from concept testing with manufacturing and supply chain SMEs to evaluate early MVP directions for Scope 3 Category 1 sustainability workflows. The research explored how organisations currently capture, manage, and operationalise emissions-related data across fragmented systems, and where a unified solution could deliver the greatest value.
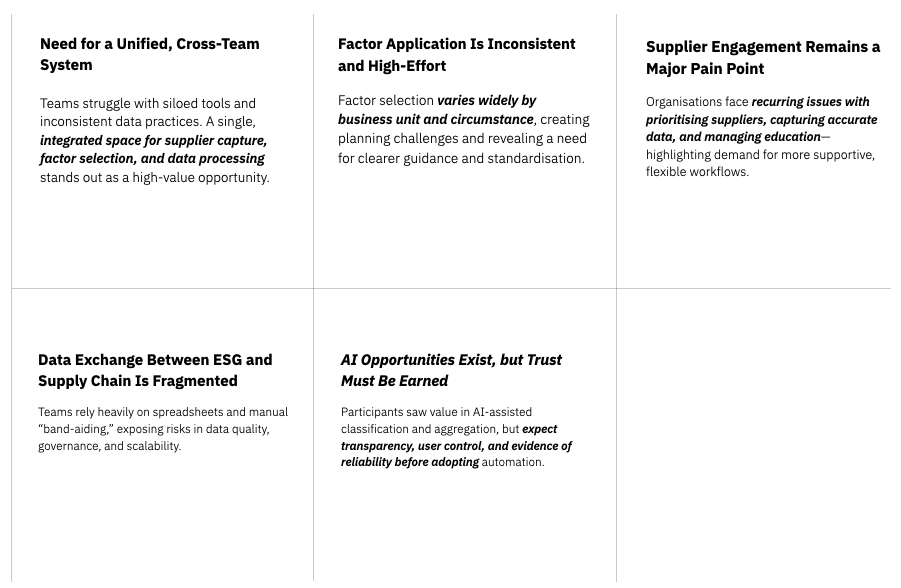
Key Research Themes
Findings highlight strong demand for flexible, governance-compatible workflows, improved data integration across ESG and supply chain teams, and greater transparency and control over factor selection, supplier engagement, and data manipulation.
Concept Testing Results
Concept testing validated core opportunities while also surfacing trust, usability, and readiness considerations that shaped MVP prioritisation and informed where automation, NLP, and advanced analytics would meaningfully support — rather than prematurely disrupt — existing decision-making processes.
The As-is Journey
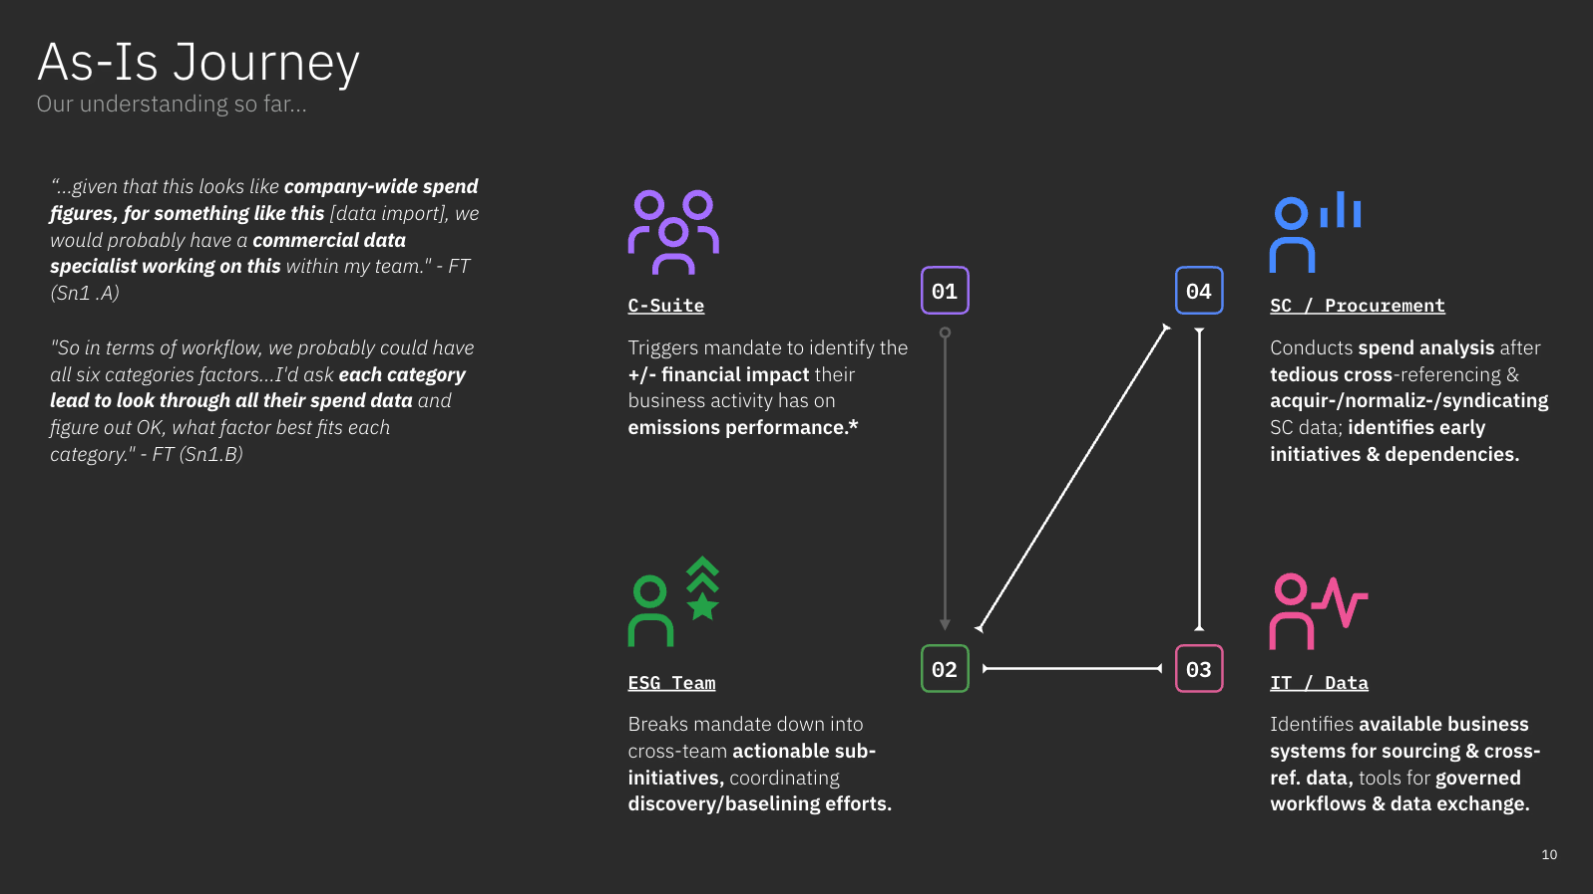
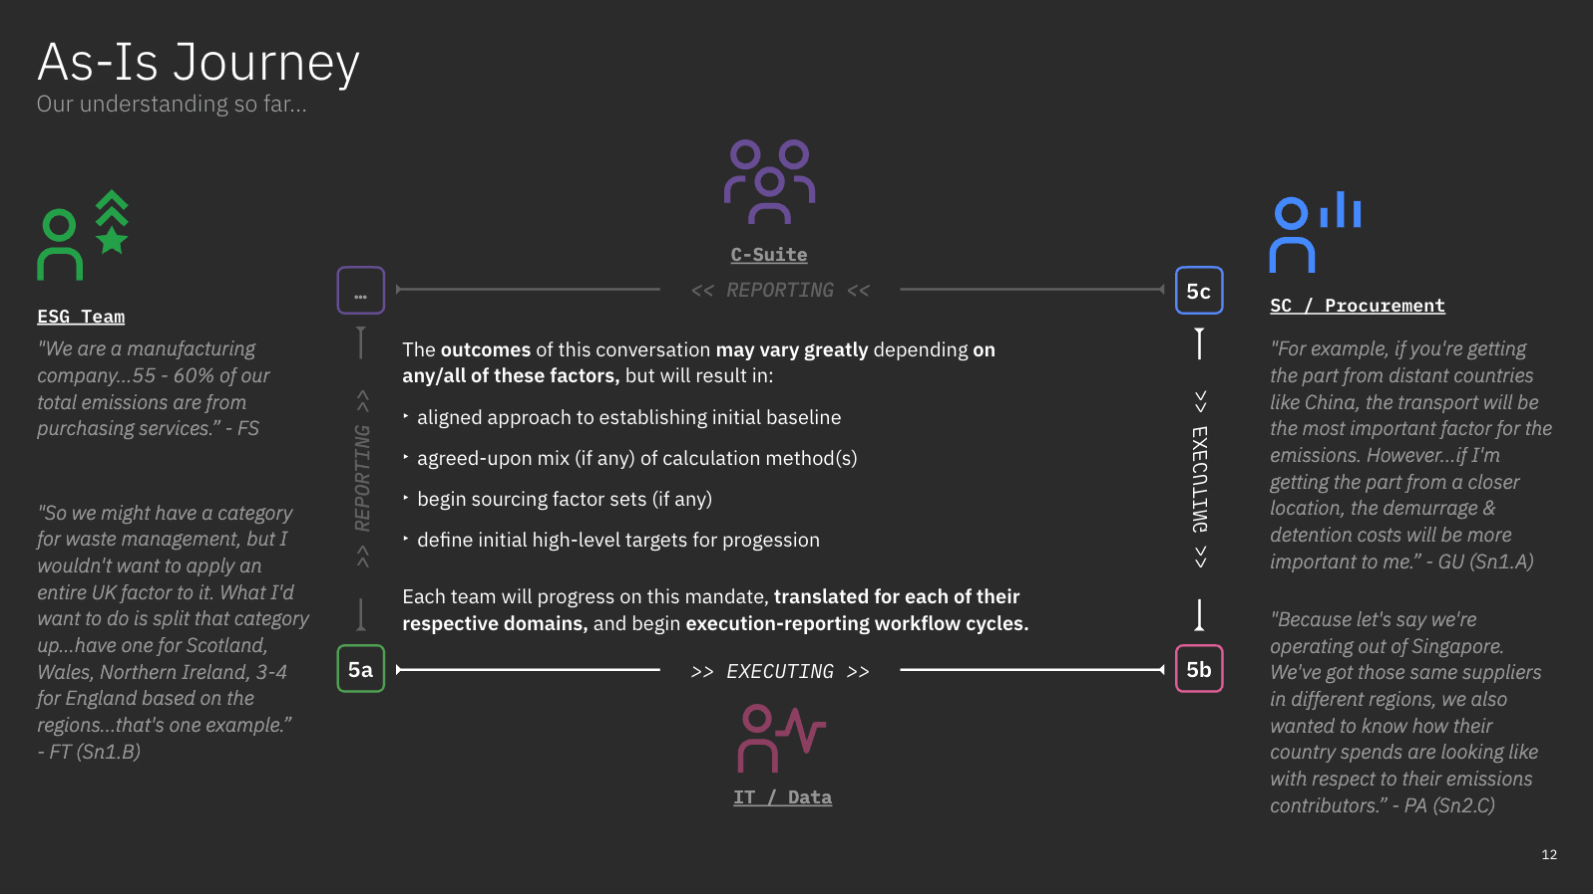
The As‑Is journey reveals a system where intent is shared but execution is fragmented. Each team contributes essential expertise, yet the lack of a unified model—shared factor library, common supplier prioritisation framework, and synchronised workflow—forces teams into repeated translation work.
The result is a cycle where:
ESG drives requirements without full operational context
Supply chain applies operational logic without ESG guardrails
IT confirms system constraints after work is already underway
C‑Suite receives reporting that is directionally correct but operationally fragile
This journey highlights the opportunity to create a connected, cross‑functional sustainability workflow that aligns operational data, ESG frameworks, and system capabilities into a coherent, consistent process.
Concept Feedback
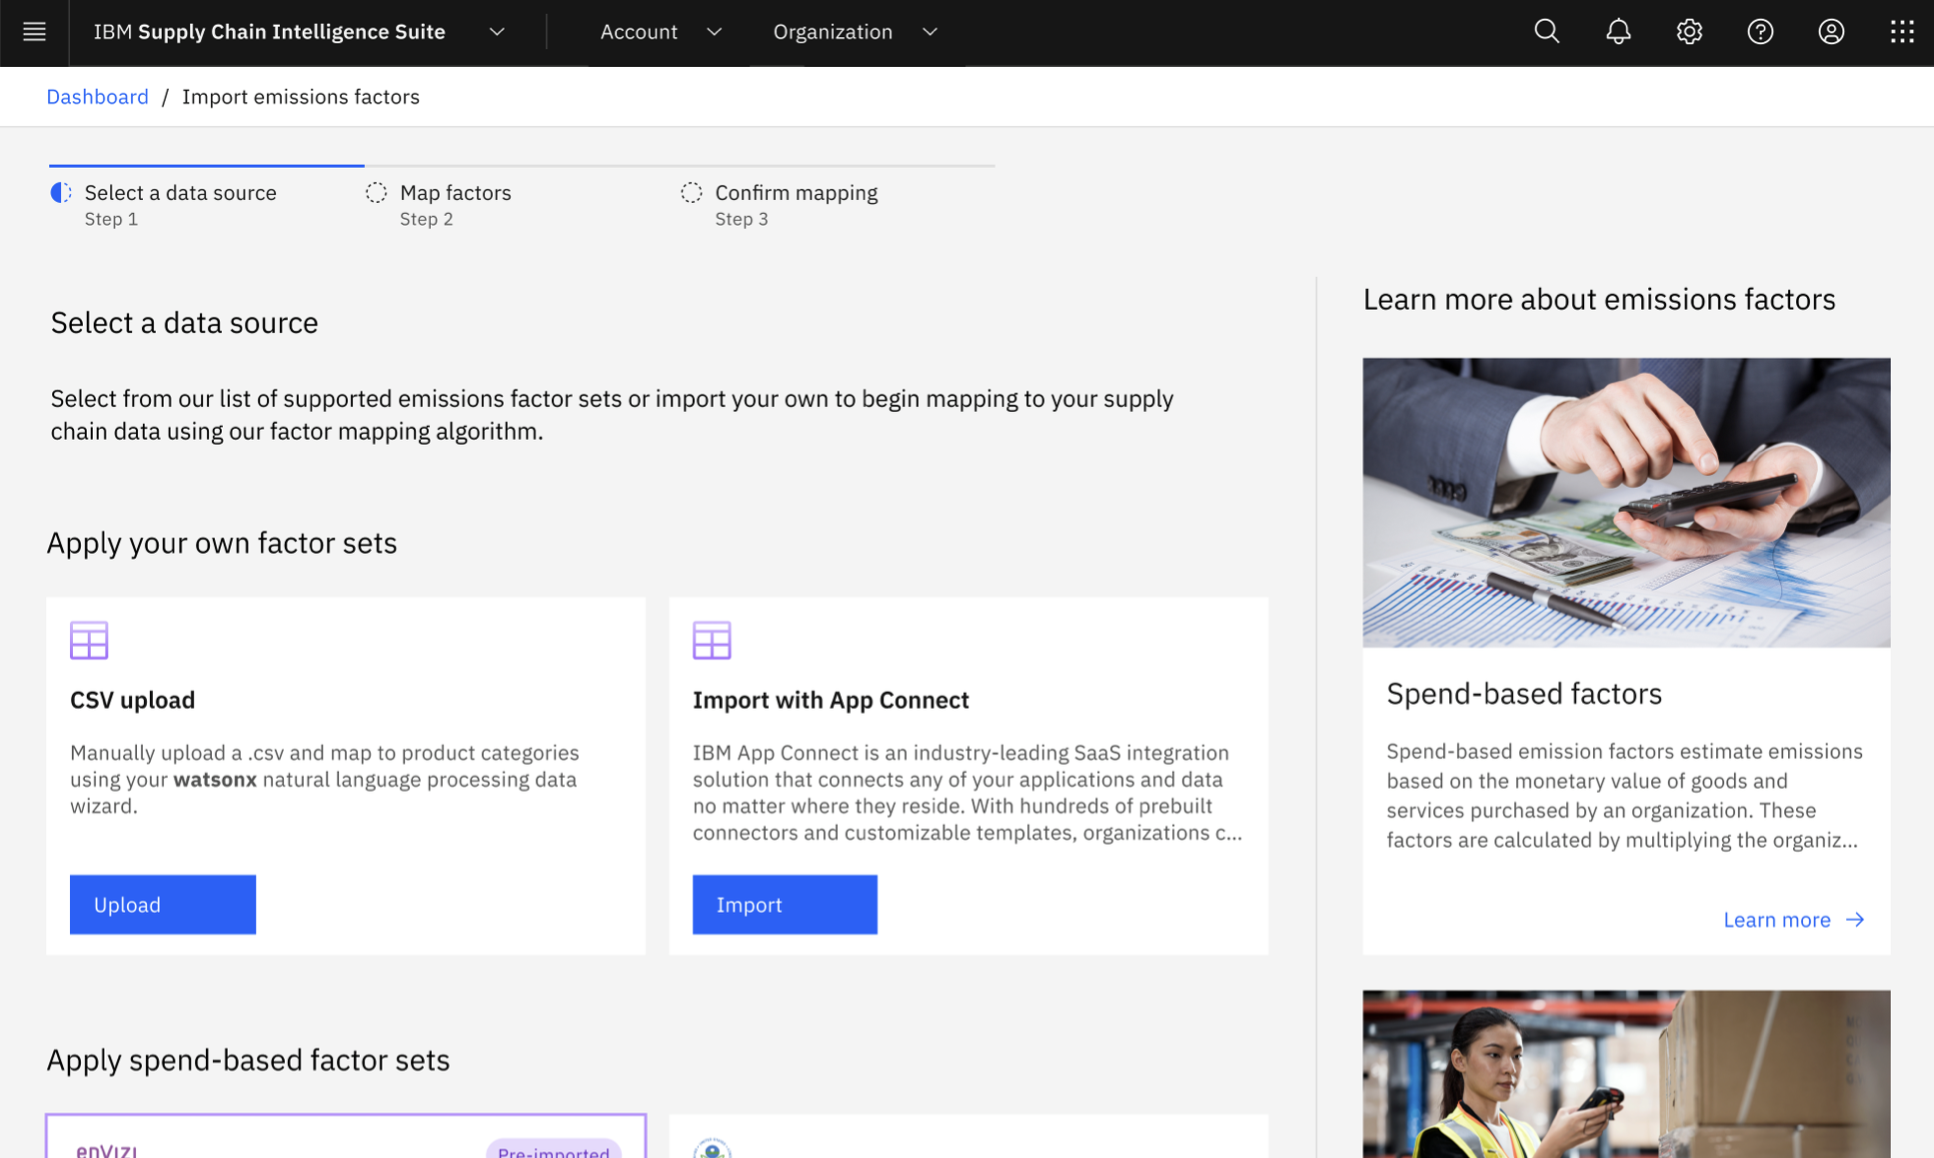
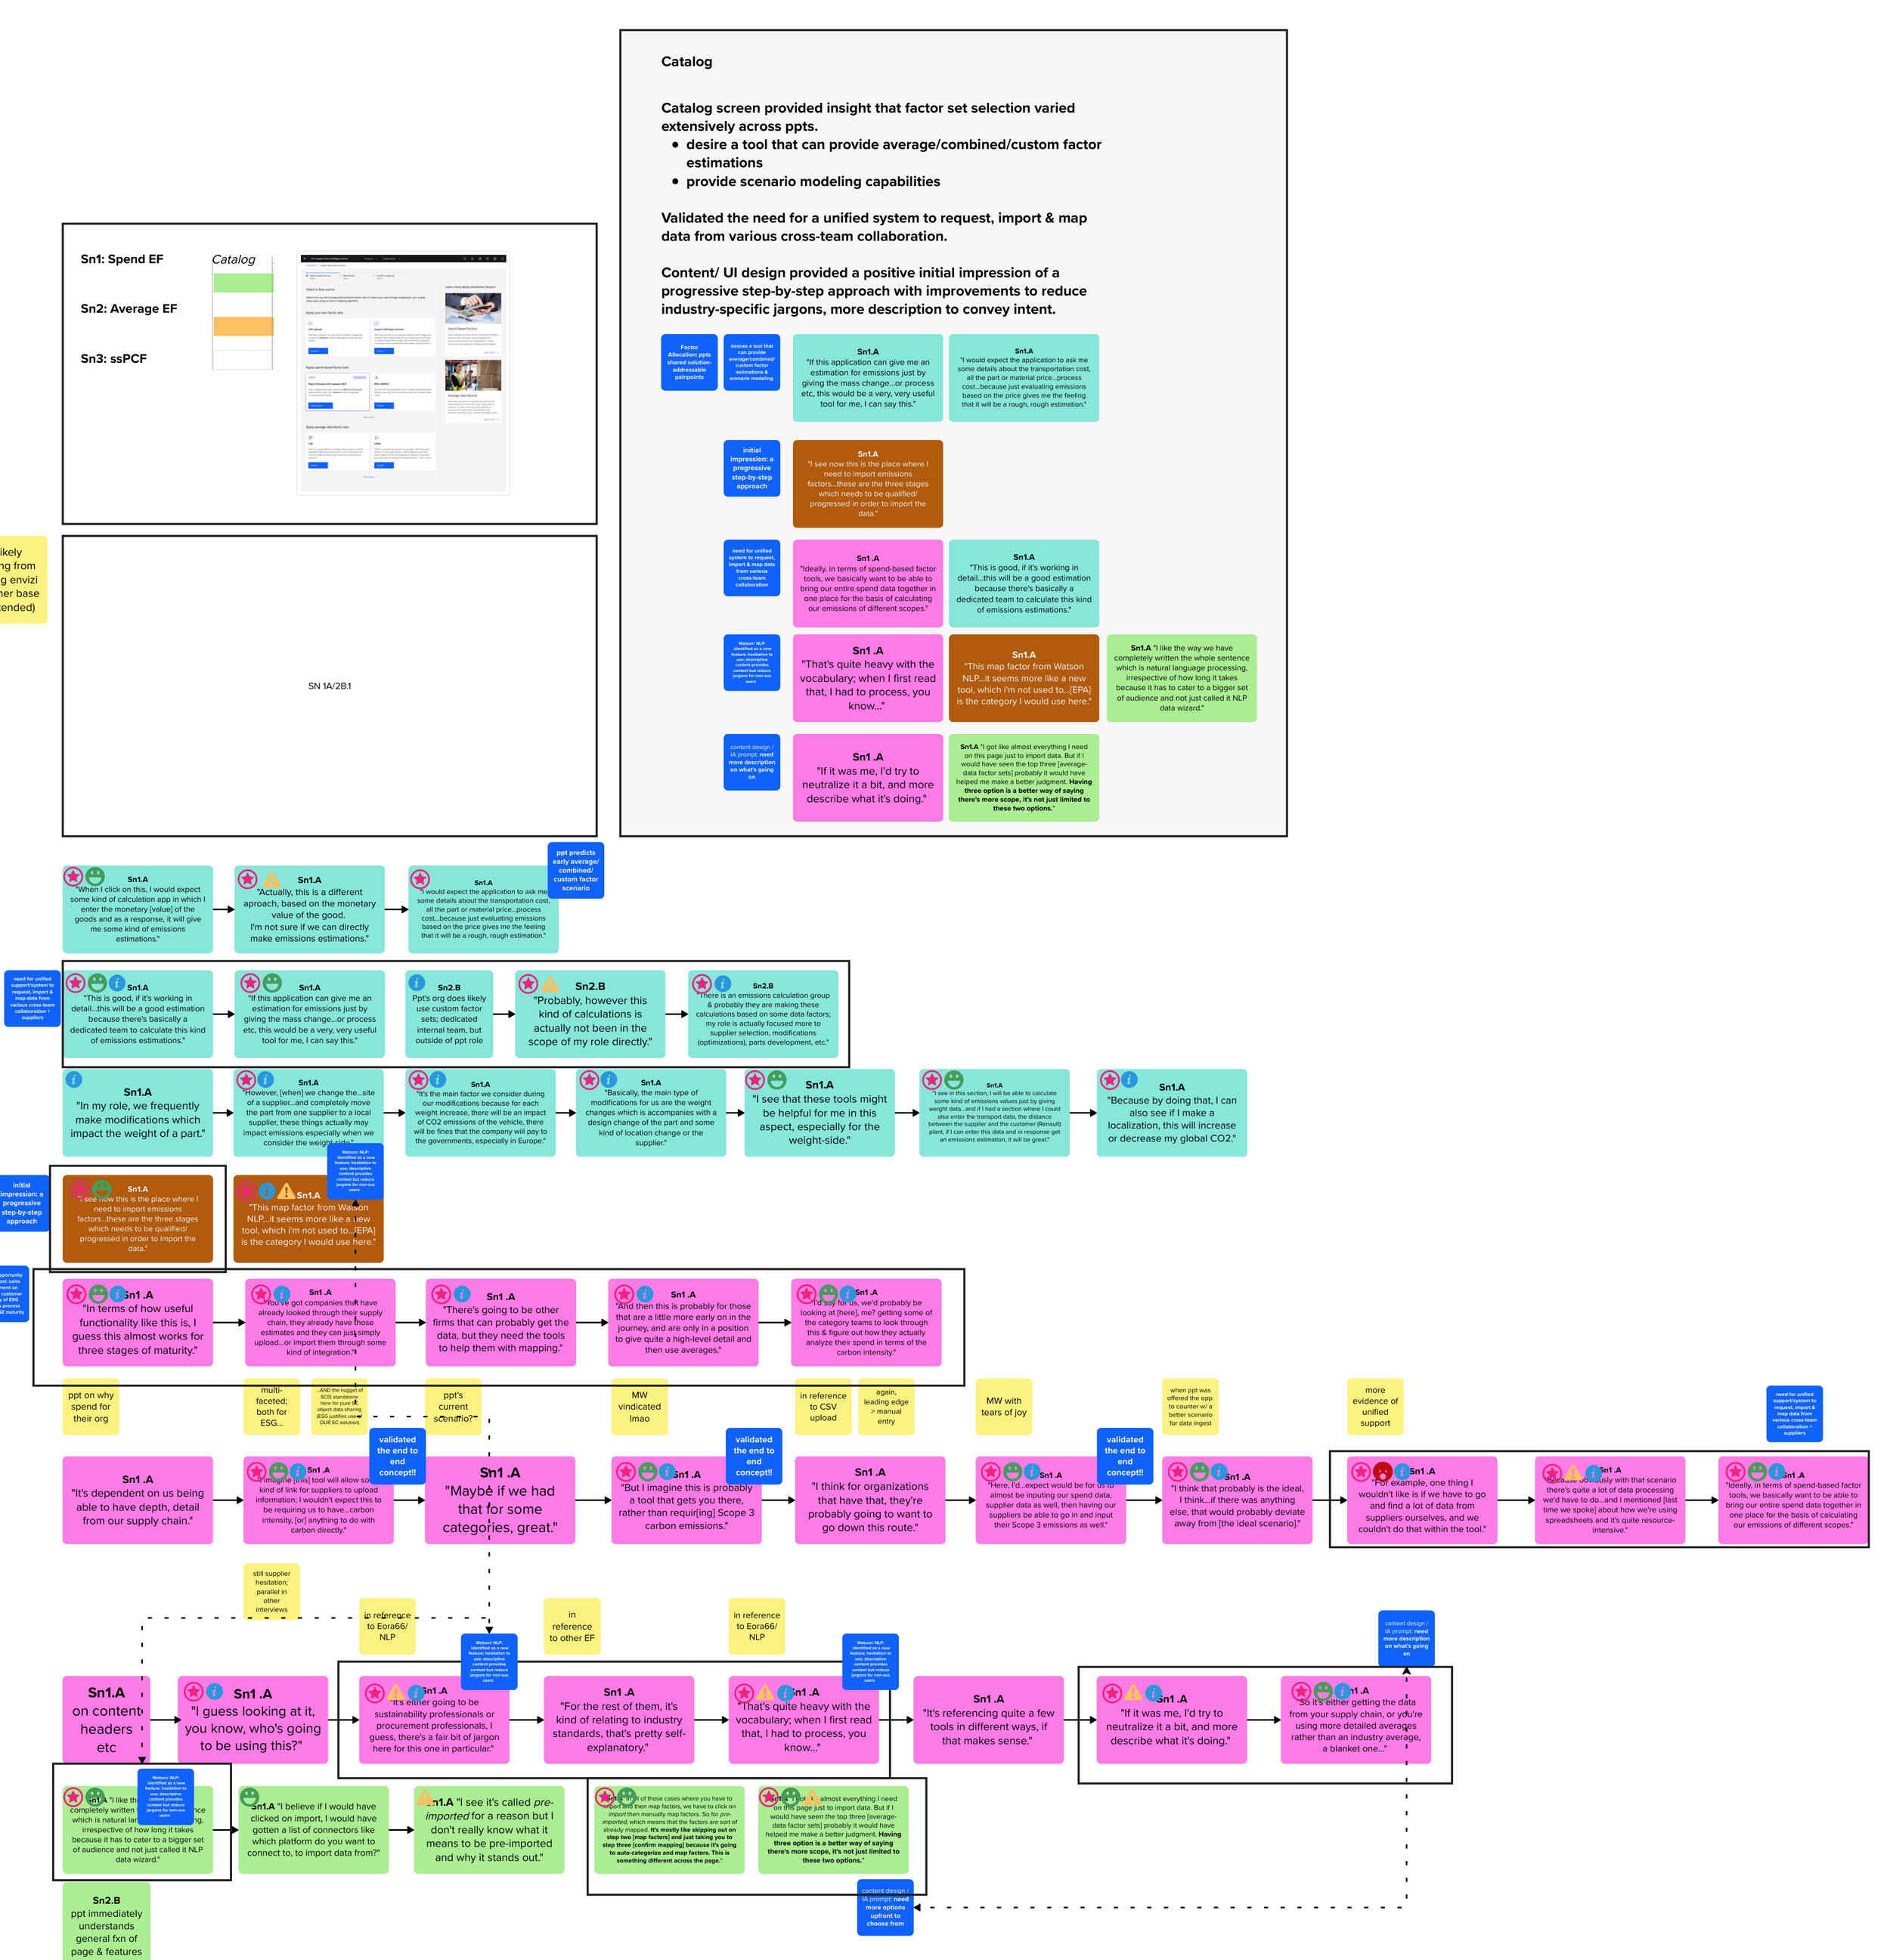
Factor catalog
Across participants, factor set selection varied extensively by business need & previously mentioned criteria. However, participants consistently expressed a desire for:
a tool that could provide average/combined/custom factor estimations
unified solution to request, import, and map data from various cross-team collaboration
"This is good, if it's working in detail...this will be a good estimation because there's basically a dedicated team to calculate this kind of emissions estimations.”
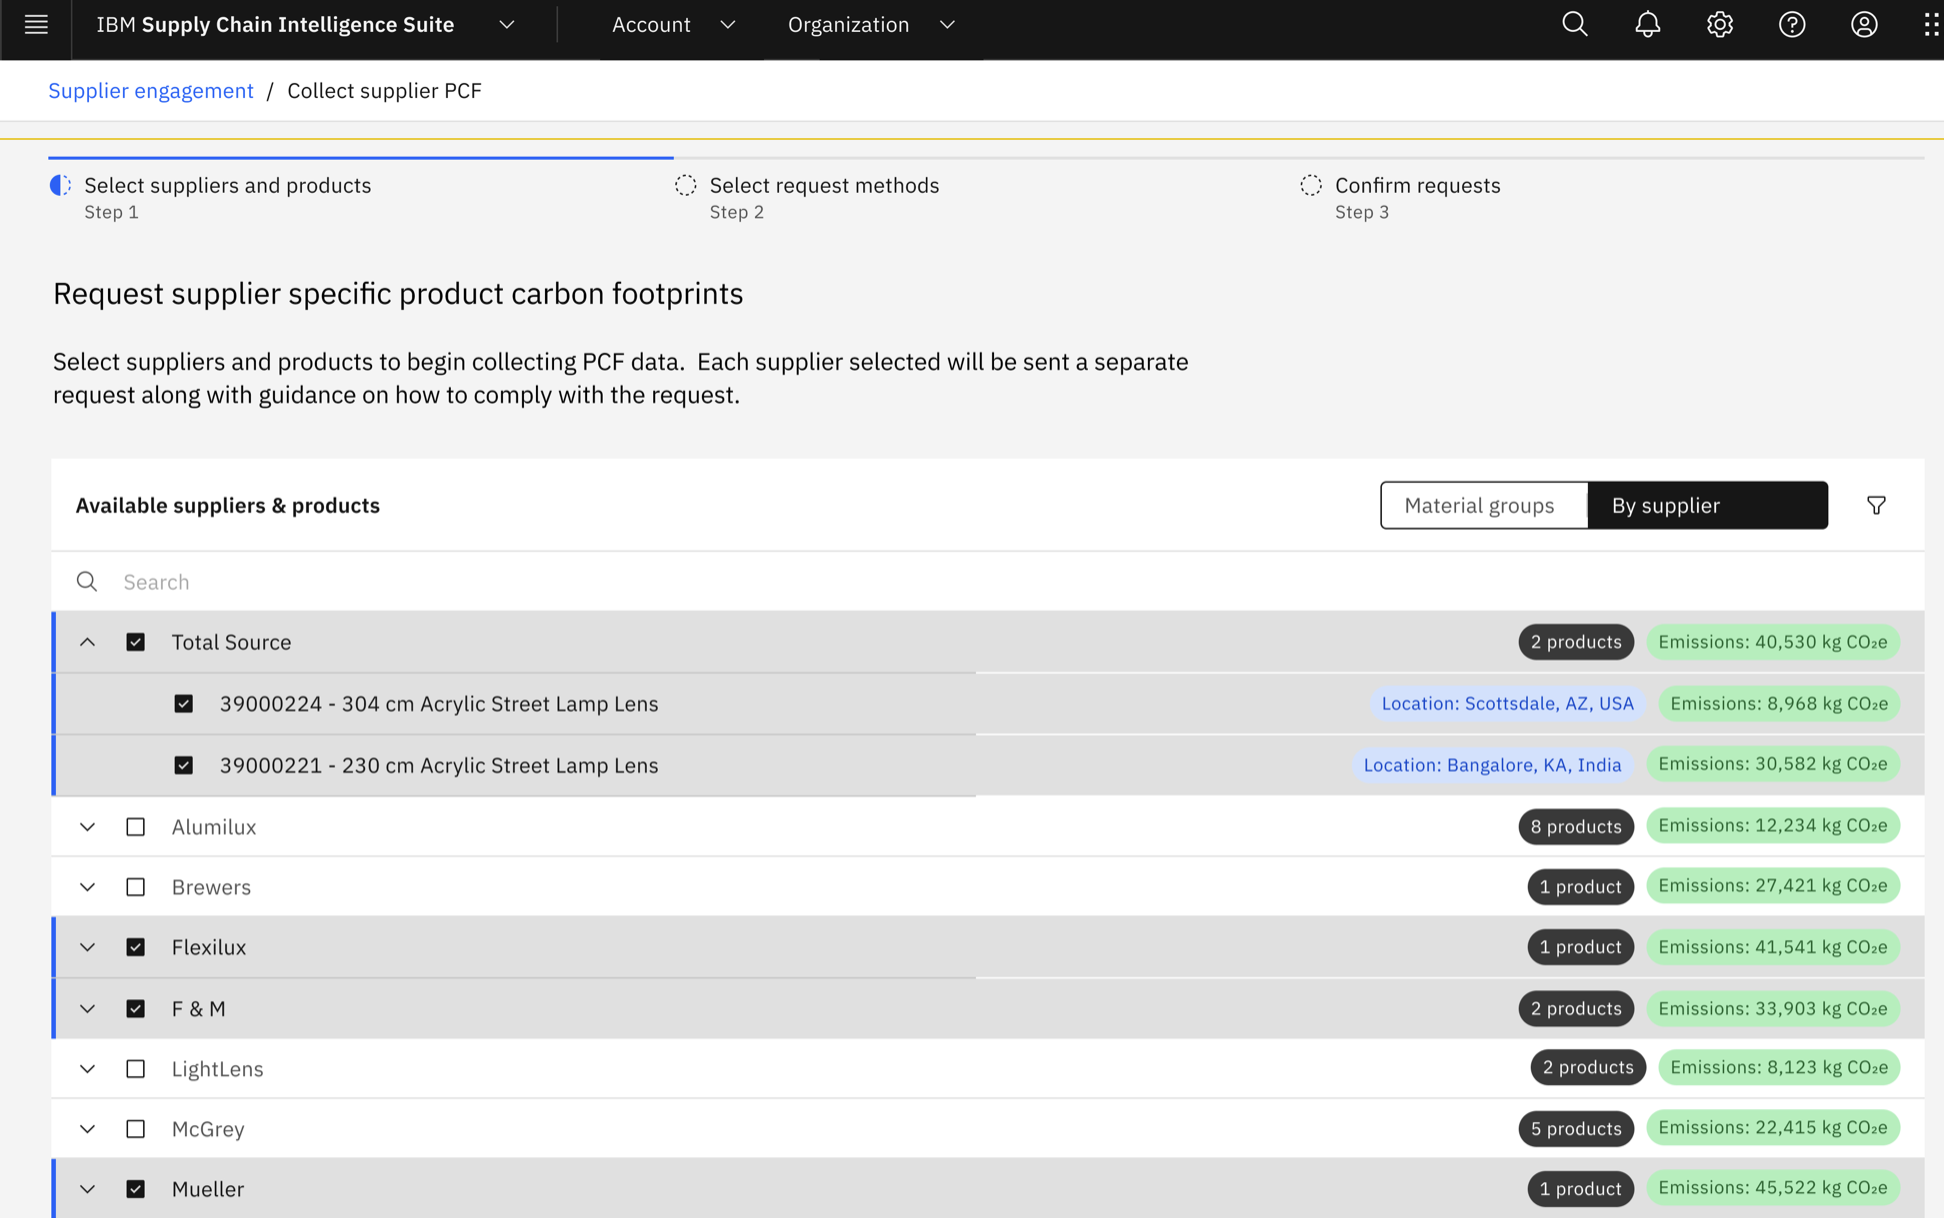
Supplier invites
Integration of a supplier information into a single platform to request and analyze supplier data was a big win for the ppts. The concept supplier invite screens baited out emerging needs:
a tool/system to request more evidence on supplier calc. methodology, factors, data sets etc.
ability to customize data request forms & templates
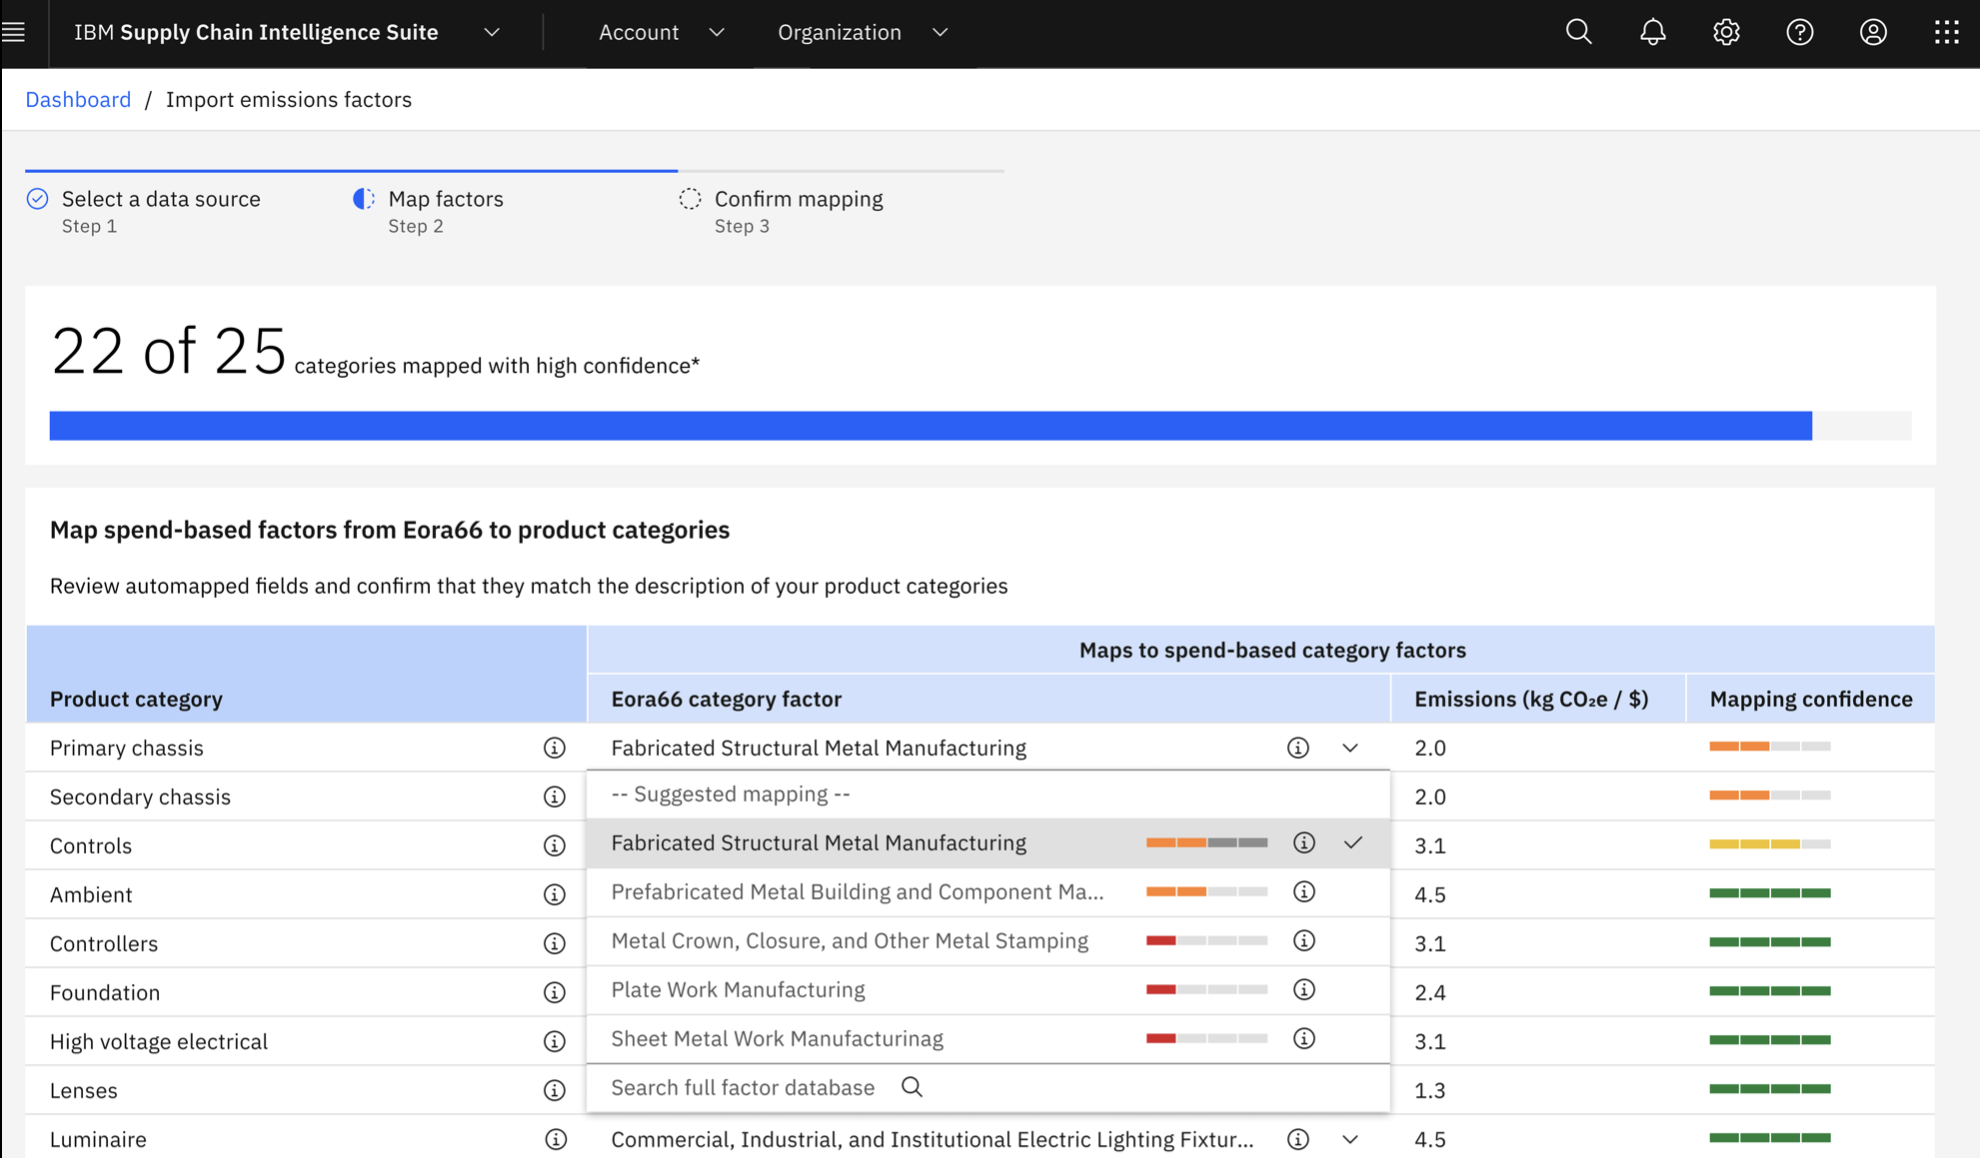
Data ingest wizard
Auto-mapping (NLP) was received by ppts as a solution to improve cross-team efficiency, reducing back & forth exchanges throughout the mapping process. Participant suggestions to increase trust & confidence include:
“one-time” education & technical/feasibility assessment
transparency into the auto-mapping logic behind confidence scoring
desire to drill-down & investigate factor source(s)
"Actually, if I trust the application...and if I know how they work overall, I think the confidence visuals would be enough for me.”
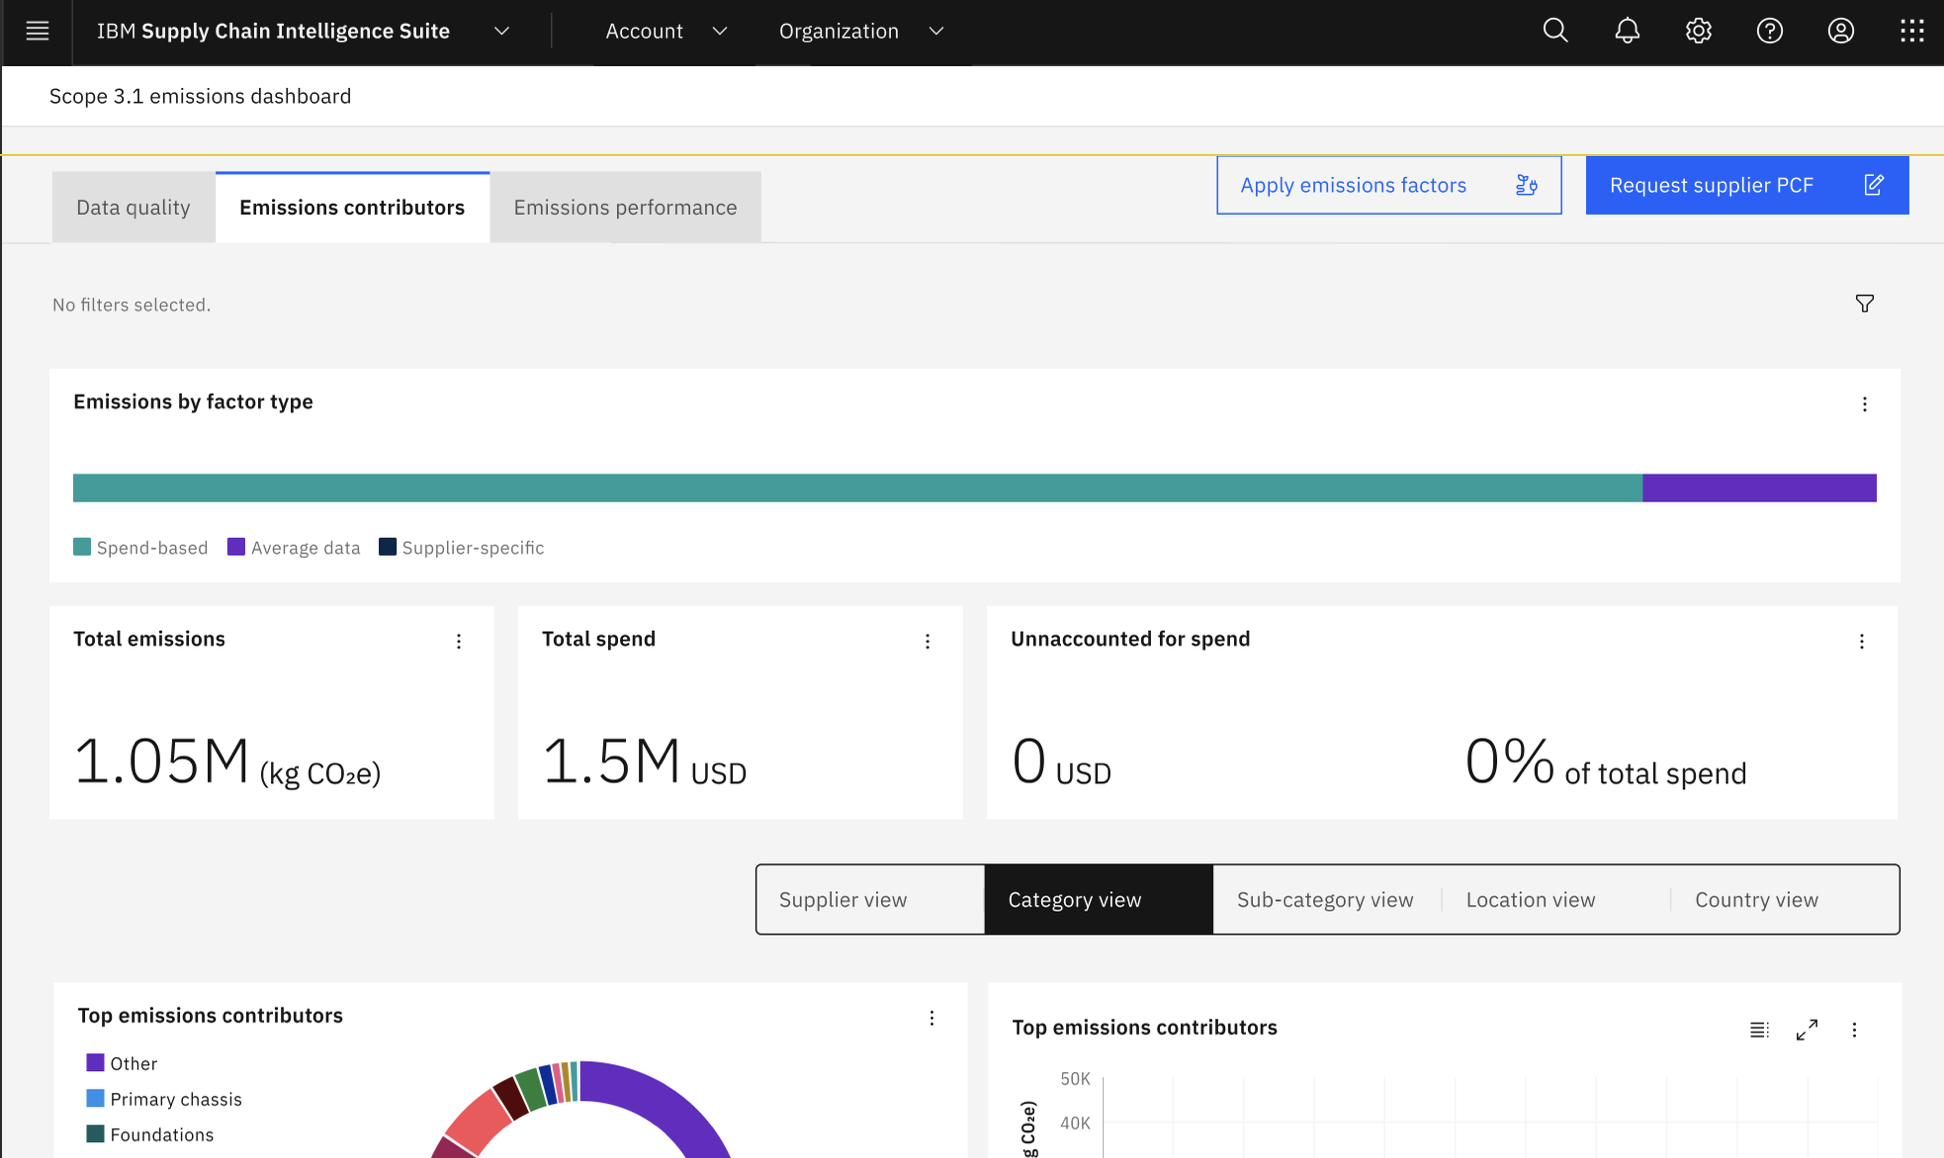
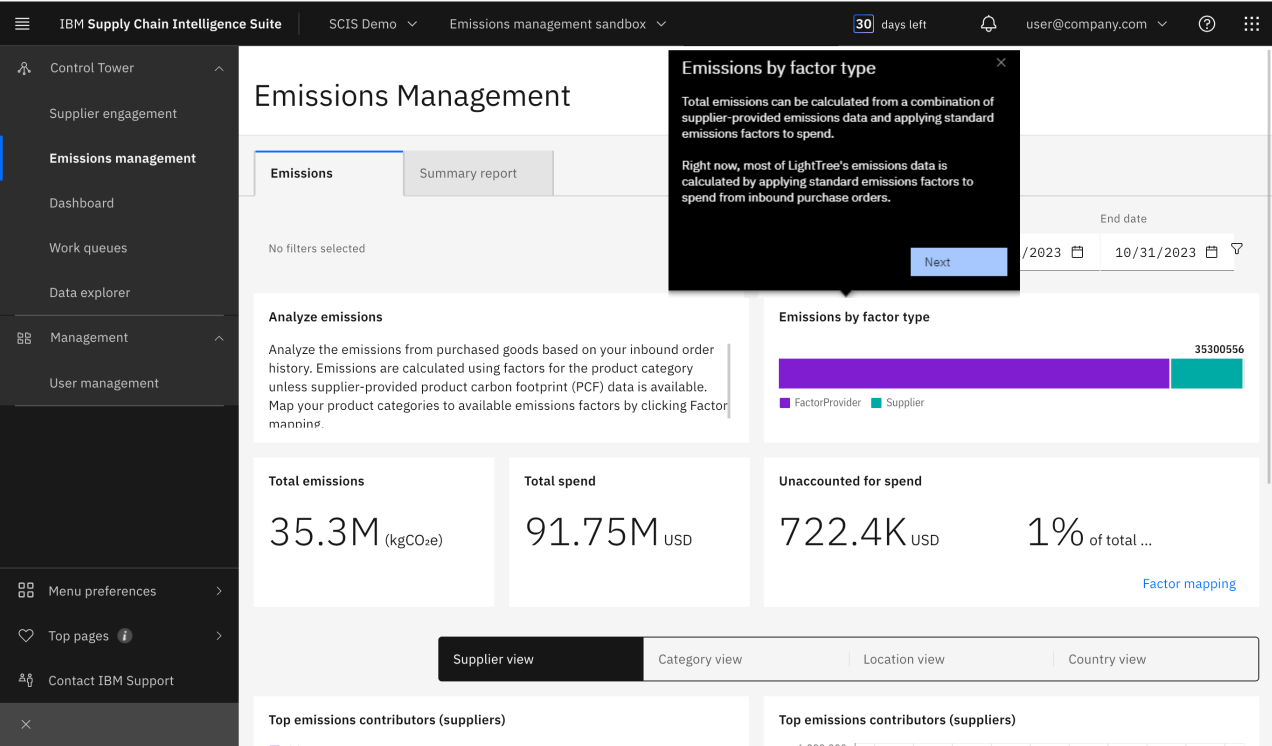
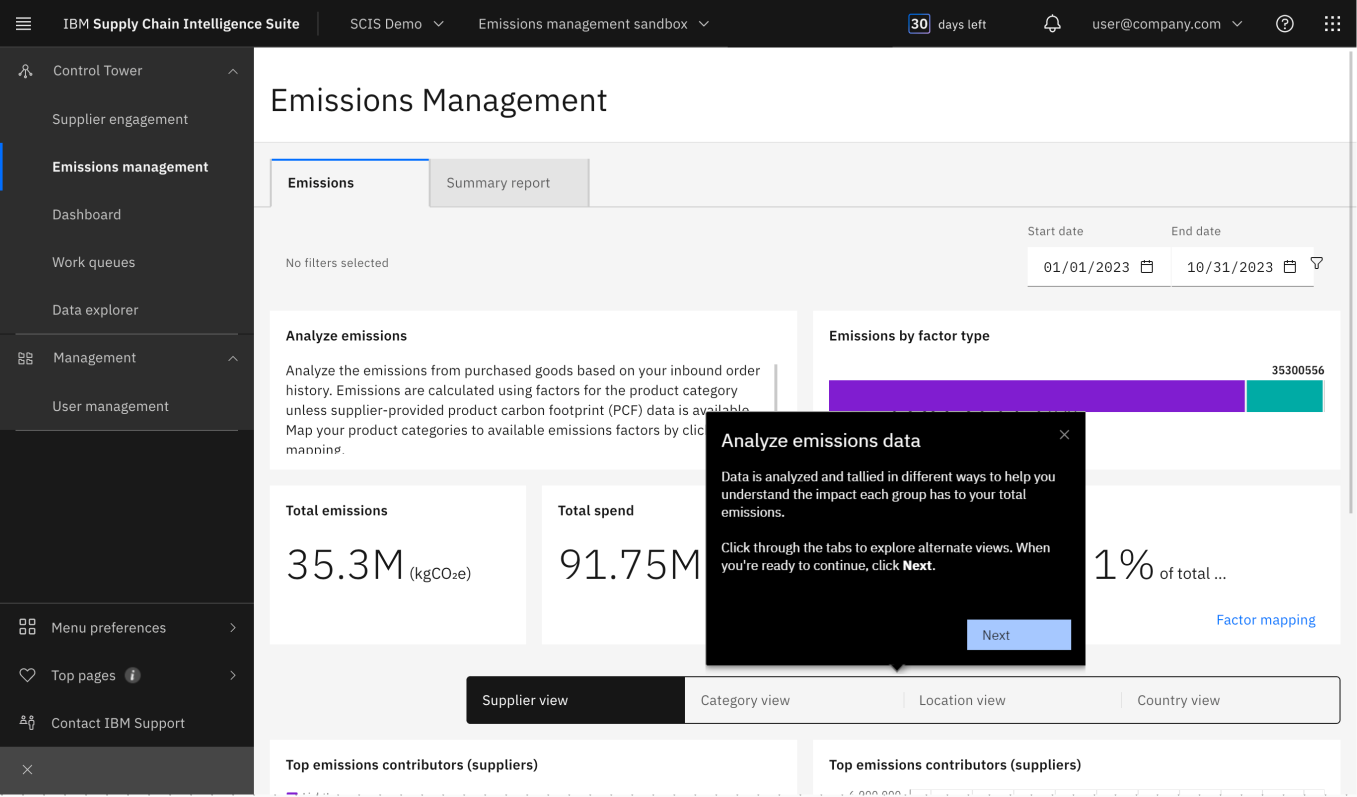
Dashboards
The 80:20 rule was observed across ppts for supplier prioritization, with a desire to get more granular information that helps manage/ mediate supplier relationships and to correlate methodology to overall company target.
There was a consistent need for further breakdown of category views (bar chart) by parameters such as:
site/facility/location/region, transport view
timeline - monthly vs yearly emissions
% share of suppliers (supplier by product category view) custom factor (like weight, volume) x monetary value
Insights to Action
In effort to understand how our research playback was truly perceived and uncover any blockers to taking action, I interviewed key stakeholders post playback.
While the persona and user journey insights were rich and provided net new understanding, the team were looking for specific product recommendations to take away immediately.
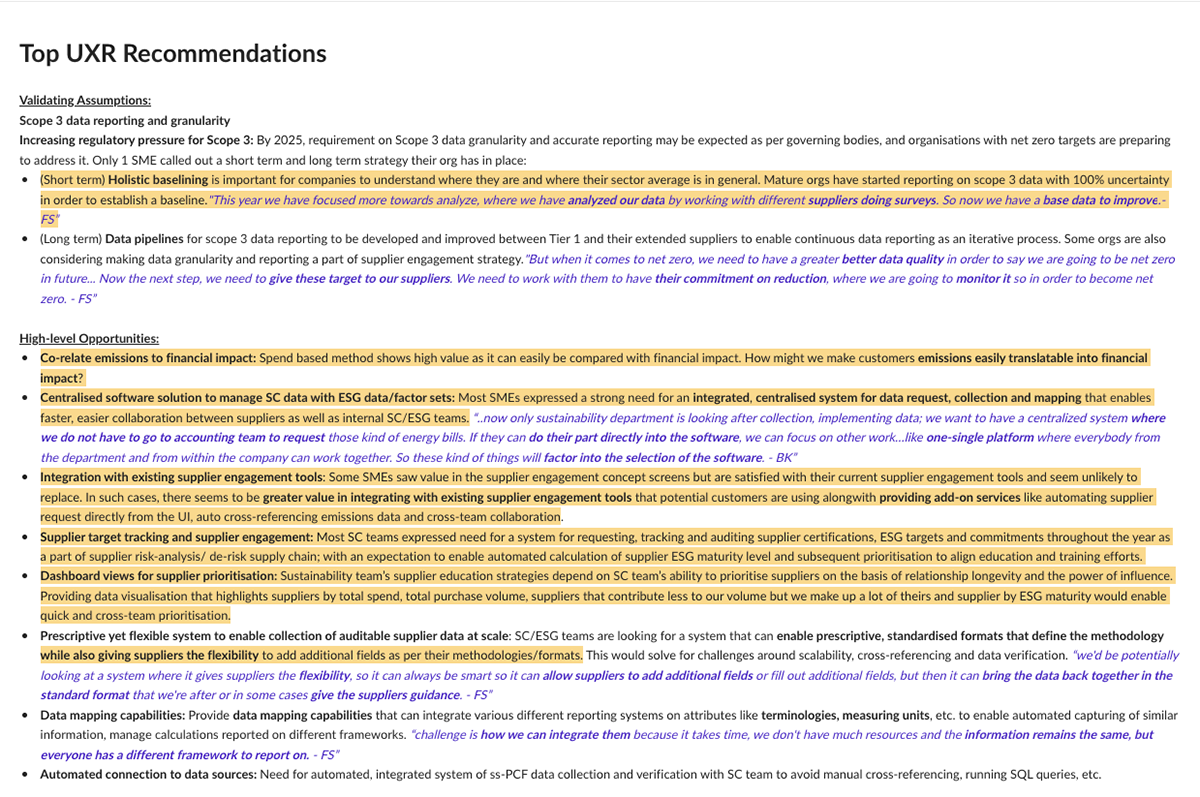
To respond to our team's needs, we created a document which specifically explained validated assumptions and highlighted product opportunities from the research. Filling in that 'so what?' aspect garnered more comments and questions, ultimately putting us back on track to apply these insights to the 'Product Led Growth' (PLG) experience of the Scope 3 solution.
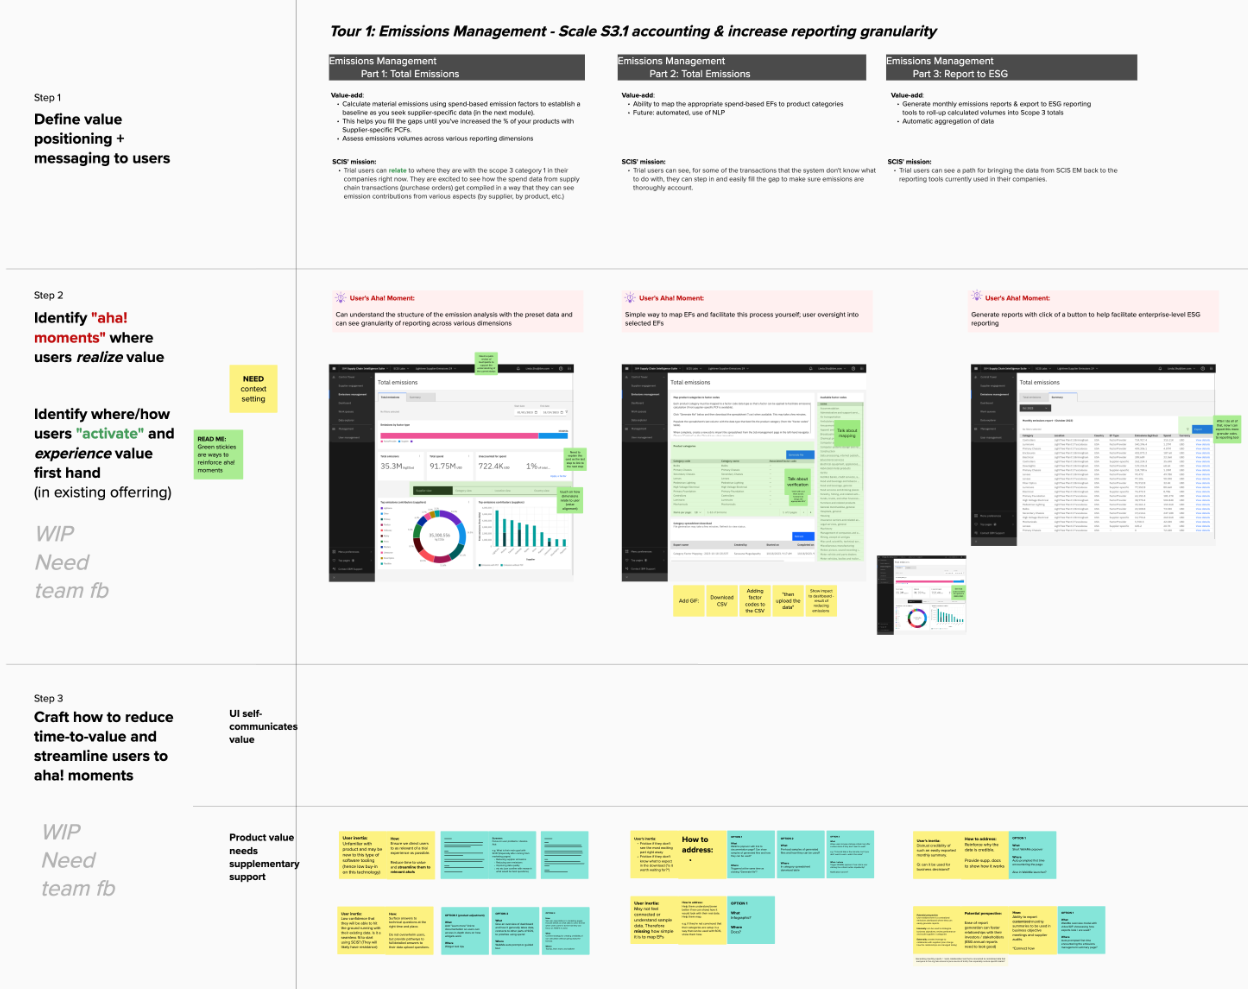
Driving Aha! Moments with PLG
With a strong software-wide organisational focus on product-led growth (PLG), these research insights and cross-functional workshops directly defined:
- The value positioning and messaging to users
- Aha! moments in the product trial
- Activation points and time to value
Project Outcomes
New IBM Logos
IBM's Scope 3 Emissions Management solution landed its first large enterprise client within the first month of product launch, and received 6 strong customer success stories within the first year of launching - particularly in the manufacturing industry, which was the recommended focus area from this project's Design research strategy.
Customer Adoption
Multi-national clients across manufacturing, travel, finance and the food industry have reported successfully using the solution to:
1. Partner with their top 400 suppliers to drive sustainability improvements
2. Leverage the tool's automated data capture to save time and resources and reduces errors
3. Removed spreadsheets from the process to minimise the risk of error in external reporting
4. Provided increased transparency over Scope 3 performance across all categories..